


Article ID: PD2601208005
Views: 603Integration of Advanced Machine Learning and Statistical Methods for High-Dimensional Genomic Data Analysis
 Article DOI
10.67887/PD2601208005
Article DOI
10.67887/PD2601208005
 PDF
PDF
⬇ Downloads: 27
1Department of Statistics, University of Malakand, Chakdara, Lower Dir, Khyber Pakhtunkhwa, Pakistan
Received: 20 February, 2026
Accepted: 22 June, 2026
Revised: 08 June, 2026
Published: 29 July, 2026
ABSTRACT:
Introduction: The growing volume of high-throughput genomic data has enabled opportunities for cancer prognosis, patient stratification and biomarker identification. But gene expression data typically consist of thousands of molecular variables and relatively few patient observations, making the data analytically challenging in terms of dimensionality, redundancy, noise, overfitting, and interpretability. To overcome these problems this work proposes a hybrid statistical and machine-learning framework to analyze breast cancer gene-expression profiles.
Methodology: The proposed workflow was tested on the dataset of Molecular Taxonomy of Breast Cancer International Consortium (METABRIC), that combines genomic measurements with related clinical data. The data preparation stages included missing-value treatment, standardisation of features, variance-based filtering, hypothesis-driven statistical screening based on t-tests and analysis of variance (ANOVA), correlation analysis, and dimensionality reduction using principal component analysis. After feature engineering, several predictive and exploratory algorithms were designed, such as: Random Forest, Multilayer Perceptron (MLP), Extreme Gradient Boosting (XGBoost), K-Means clustering, and Ensemble Learning. The accuracy, precision, recall, F1 score, Receiver Operating Characteristic Area Under the Curve (ROC-AUC), cross validation performance and silhouette coefficient measures were used to assess model effectiveness.
Results: Experimental results showed that MLP classifier outperformed other classifiers in terms of prediction accuracy while ensemble model resulted in the best ROC-AUC value.
Conclusion: The findings suggest that statistical feature selection combined with machine learning-based feature importance analysis can boost predictive power while simultaneously providing greater importance for biologically relevant features. The overall proposed framework offers a comprehensive strategy for genomic classification, prioritisation of candidates as biomarkers, and the creation of data-driven decision-support tools in the context of breast cancer research and precision oncology applications.
Keywords: Genomic data analysis, high-dimensional data, machine learning, statistical methods, feature selection, breast cancer, metabric, interpretability, hybrid modelling.
1. INTRODUCTION
Large-scale genomic data provide important opportunities for understanding cancer survival outcomes. However, these data are difficult to analyse because they contain thousands of gene-expression features and relatively fewer patient samples [1]. This imbalance increases the risk of overfitting and makes it difficult to identify clinically meaningful patterns. Machine learning models can capture complex and non-linear relationships in genomic data, but they often provide limited biological explanation [2]. In contrast, statistical methods such as t-tests, ANOVA, correlation analysis, and PCA provide clearer inference and dimensionality reduction, but they may not fully capture complex predictive patterns [3]. Therefore, this study provides and evaluates an integrated statistical–machine learning framework for predicting breast cancer death using the METABRIC dataset. The purpose of this framework is to improve predictive accuracy while preserving biological interpretability.
Ensemble-based machine learning techniques, including Random Forest and XGBoost, are widely recognised for their capacity to capture complex and non-linear patterns in genomic datasets. In contrast, statistical procedures such as Principal Component Analysis (PCA) and t-tests provide structured dimensionality reduction, hypothesis testing, and inferential support [4]. Recent genomic studies show that the two can be combined to balance the predictive accuracy and interpretability. The availability of genomic data at the large scale, the derivation of practical patterns, such as survival outcomes in breast cancer, is a complex problem due to such challenges as noise, over fitting, and the unscaled nature of the conventional analytical process [5]. These obstacles hamper the process of converting genomic data into valid clinical data, in particular when the data volume is high-dimensional, and the sample size is much less than the number of features [6]. There is a discontinuity in the current methodological environment because methods are primarily predicated upon machine learning (ML) to produce high precision and low interpretability (e.g., neural networks) or interpretability but low scalability (e.g., ANOVA).
This study provides and evaluates an integrated machine learning–statistical framework designed for high-dimensional genomic data analysis, with specific application to cancer-death prediction using the METABRIC breast cancer dataset. The framework uses the advantages of both ML and statistical approaches to overcome the limitations of the genomic data set, including noise and dimensionality, and improve predictive accuracy and biological interpretation. The study objectives are as follows: to preprocess the METABRIC data with the help of statistical preprocessing and feature reduction methods, to train advanced ML models to binary classify the survival outcomes, to compare the results of both the ML and statistical models with quantitative indicators, and to find the biologically significant genes utilized in the models. These procedures establish a robust pipeline connecting classical statistical rigor to the present-day ML opportunities.
This study is guided by three main research questions. First, how can statistical and machine-learning approaches be effectively combined for genomic data analysis? Second, which predictive models offer the strongest performance when applied to high-dimensional breast cancer gene-expression data? Third, how can statistical validation strengthen confidence in the biological relevance of the selected genes and clinical variables? These questions provide the basis for evaluating the methodological and practical value of the proposed hybrid framework for interpretable genomic prediction. While the combined use of statistical analysis and machine learning has previously been explored in genomic research, the novelty of this study is not based on the introduction of a new dataset. The METABRIC dataset is an established public breast cancer dataset. The novelty of this study lies in the structured design and validation of a hybrid analytical pipeline that combines statistical filtering, machine learning feature ranking, dimensionality reduction, supervised classification, unsupervised clustering, and model interpretability within a single workflow. Unlike studies that apply either statistical inference or machine learning independently, this study links ANOVA/t-test-based statistical screening with Random Forest feature importance, PCA-based dimensionality reduction, ensemble prediction, and permutation-based interpretation. Therefore, the main contribution is methodological and application-oriented: it demonstrates how an integrated framework can improve predictive reliability while maintaining biological interpretability for high-dimensional breast cancer gene-expression analysis [7, 8].
The paper is organized in a way that outlines the research process and results in a coherent manner. In section II, a comprehensive review of the literature, covering the existing work on ML and statistical methods in genomics is carried out. In Section III, the methodology is presented, including data preprocessing, modelling and validation. The results are presented in Section IV, including the metrics assessed as well as the gene insights obtained from the analysis. The findings are discussed in Section V with interpretations of the biological and methodological implications. Last but not least, Section VI summarizes the work and offers some ideas about future research directions.
2. LITERATURE REVIEW
The integration of advanced computational techniques with genomic analysis has significantly influenced the development of precision medicine, particularly in understanding complex diseases such as breast cancer [9]. This literature review discusses the progression of machine-learning and statistical approaches in genomics, their relevance to high-dimensional datasets, and the remaining limitations in existing hybrid analytical frameworks. Particular attention is given to methods suitable for METABRIC-based analysis, including feature selection, classification, dimensionality reduction, and interpretability. This review therefore establishes the foundation for the proposed integrated statistical and machine-learning framework.
2.1. Evolution of Machine Learning in Genomics
Machine learning has become increasingly important in genomic research because it enables the identification of hidden structures and predictive signals within high-dimensional biological data that may not be easily captured by conventional statistical techniques. (Watson, 2022) [10] noted that recent progress in machine learning has been particularly evident in ensemble methods, including Random Forest and XGBoost, which have shown strong performance in cancer-related classification and feature-selection tasks [10]. Random Forest has been widely adopted in breast cancer genomics because it can manage multicollinearity, model complex interactions, and generate variable-importance scores that help prioritise potentially meaningful genetic markers [11]. Similarly, XGBoost is an optimized gradient boosting model that is useful in making predictions, and it has the ability to simplify decision trees, hence its ability to handle imbalanced data sets and complex interactions among genes [12]. Such methods have observed a classification performance exceeding 0.85 in diverse genomic environments, which implies that they were used to predict survival outcome. Nevertheless, they are more black boxes, which curtails biological understandability, a crucial aspect in clinical practice where mechanistic understanding is demanded.
2.2. Role of Statistical Frameworks in Genomic Analysis
The genomic data is still analysed statistically, and this is an appropriate starting point from which conclusions can be drawn and the data dimensioned [13]. Techniques such as PCA for dimensionality reduction and t-tests for statistical significance remain widely used. The major benefit of PCA is when the data set is large, such as the METABRIC data where there are 25,000 gene expression features that are being correlated with a few main components (PCs) accounting for a significant amount of the variance. Also useful are t-tests and ANOVA to discover genes or clinical characteristics that are significantly different between molecular subtypes and/or survival groups in breast cancer. These statistical procedures help achieve inferential validity and determine if observed differences between the outcome groups is a meaningful difference or a random difference. Gene-expression and multi-omics data have been used in previous breast cancer molecular-profiling studies to identify biologically significant tumour subgroups and to gain insights into the variation in prognosis-related data [14]. The Cancer Genome Atlas Network further confirmed the major molecular subtypes of breast cancer through integrated genomic, transcriptomic, methylation, and proteomic profiling [15].
2.3. Integration Approaches in Genomic Studies
Recent studies have increasingly investigated hybrid workflows that combine statistical screening with machine-learning modelling in order to benefit from the strengths of both approaches. [16] applied ANOVA as an initial feature-selection stage before using Random Forest-based feature-importance analysis to improve model robustness. In classification problems, this type of workflow can improve performance by allowing biologically relevant variables to be prioritised before model training, particularly in high-dimensional datasets where irrelevant or noisy features may reduce predictive reliability. Statistical filtering can help reduce overfitting by removing weak or redundant variables, while machine-learning algorithms can capture non-linear associations that traditional methods may overlook. However, many existing hybrid approaches still require stronger validation across multiple datasets and more systematic use of explainability techniques, which limits their wider applicability. In this context, the METABRIC dataset offers a valuable testing ground because it contains extensive clinical and genomic annotations that have not always been fully exploited in integrated analytical pipelines [17].
2.4. Previous Work on the METABRIC Dataset
The METABRIC dataset contains gene-expression and clinical information for approximately 1,900 breast cancer patients and has been extensively used in genomic oncology research. (Herath, 2024) [17] examined unsupervised approaches such as K-Means clustering and reported silhouette scores ranging from 0.3 to 0.4, suggesting moderate cluster separation [17]. Owing to its combination of molecular profiles and long-term clinical outcome data, METABRIC remains a valuable resource for studying breast cancer heterogeneity. Similarly, The Cancer Genome Atlas Network [16] showed that multi-platform molecular profiling can distinguish clinically important breast cancer subtypes, including luminal A, luminal B, HER2-enriched, and basal-like tumours. The overall findings of these studies demonstrate that the molecular heterogeneity of breast cancer can be identified, and genomic information can be used for biomarker discovery, survival analysis and discovery of tumour subtypes. Previous studies based on the METABRIC have, however, largely been based on either unsupervised clustering or supervised prediction. This leaves room for a methodological gap as integrated frameworks integrating statistical validation, machine learning classification, dimensionality reduction and model interpretability in one reproducible pipeline.
2.5. Gaps in Current Hybrid Models
In spite of these improvements, there are numerous gaps in formulating hybrid ML-statistic models. Frameworks that contain explainability tools, including SHAP (Shapley Additive explanations) or permutation importance, are lacking, and are essential to make predictions with models that can be translated into a biological understanding. The lack of performance measures (e.g., accuracy, AUC) in existing hybrid models against a validated performance measure that may serve as a biological measure is a weakness that undermines their capacity to be strong in the clinical setting. In addition, the majority of the research does not involve large-scale cross-validation or binary survival prediction issues, and the ones associated with METABRIC dataset are not exceptions. We fill in these gaps in our framework, which consists of statistically validating (e.g., by t-tests) features that were statistically important using the ML-based feature importance, which is determined by 5-fold cross-validation of a binary outcome (death due to cancer). The approach can also encourage predictive power and ensure the identified genes fall in line with the known biological pathways which is an improvement to their inadequacies.
2.6. Implications for the Proposed Framework
The literature review demonstrates a need of a robust interpretable framework that incorporates ML and statistical analysis that can be determined to apply to high-dimensional genomic data. The random forest and the XGBoost in classifying the inferential capabilities of the PCA and t -tests are so effective that the synergy opportunity that has not been achieved yet is presented. Prior METABRIC studies provide a foundation, yet its independent analyses limit it. This study contributes to the addition of a new pipeline with the assistance of sealing the identified gaps, particularly, with the assistance of hybrid validation and explainability tools. It is a pipeline that was trained on the METABRIC dataset considering binary survival prediction taking into account and is bound to play a part in further genomic research studies.
3. METHODOLOGY
The following section describes the methodology used to create and test an integrated machine learning (ML) statistical model to analyse high-dimensional genomic data, namely, death prediction in breast cancer using the METABRIC dataset. The method uses statistical preprocessing and sophisticated ML methods, which are confirmed by stringent performance indicators and biological interpretation, to deal with the issues of dimensionality, noise, and interpretability (Fig. 1).
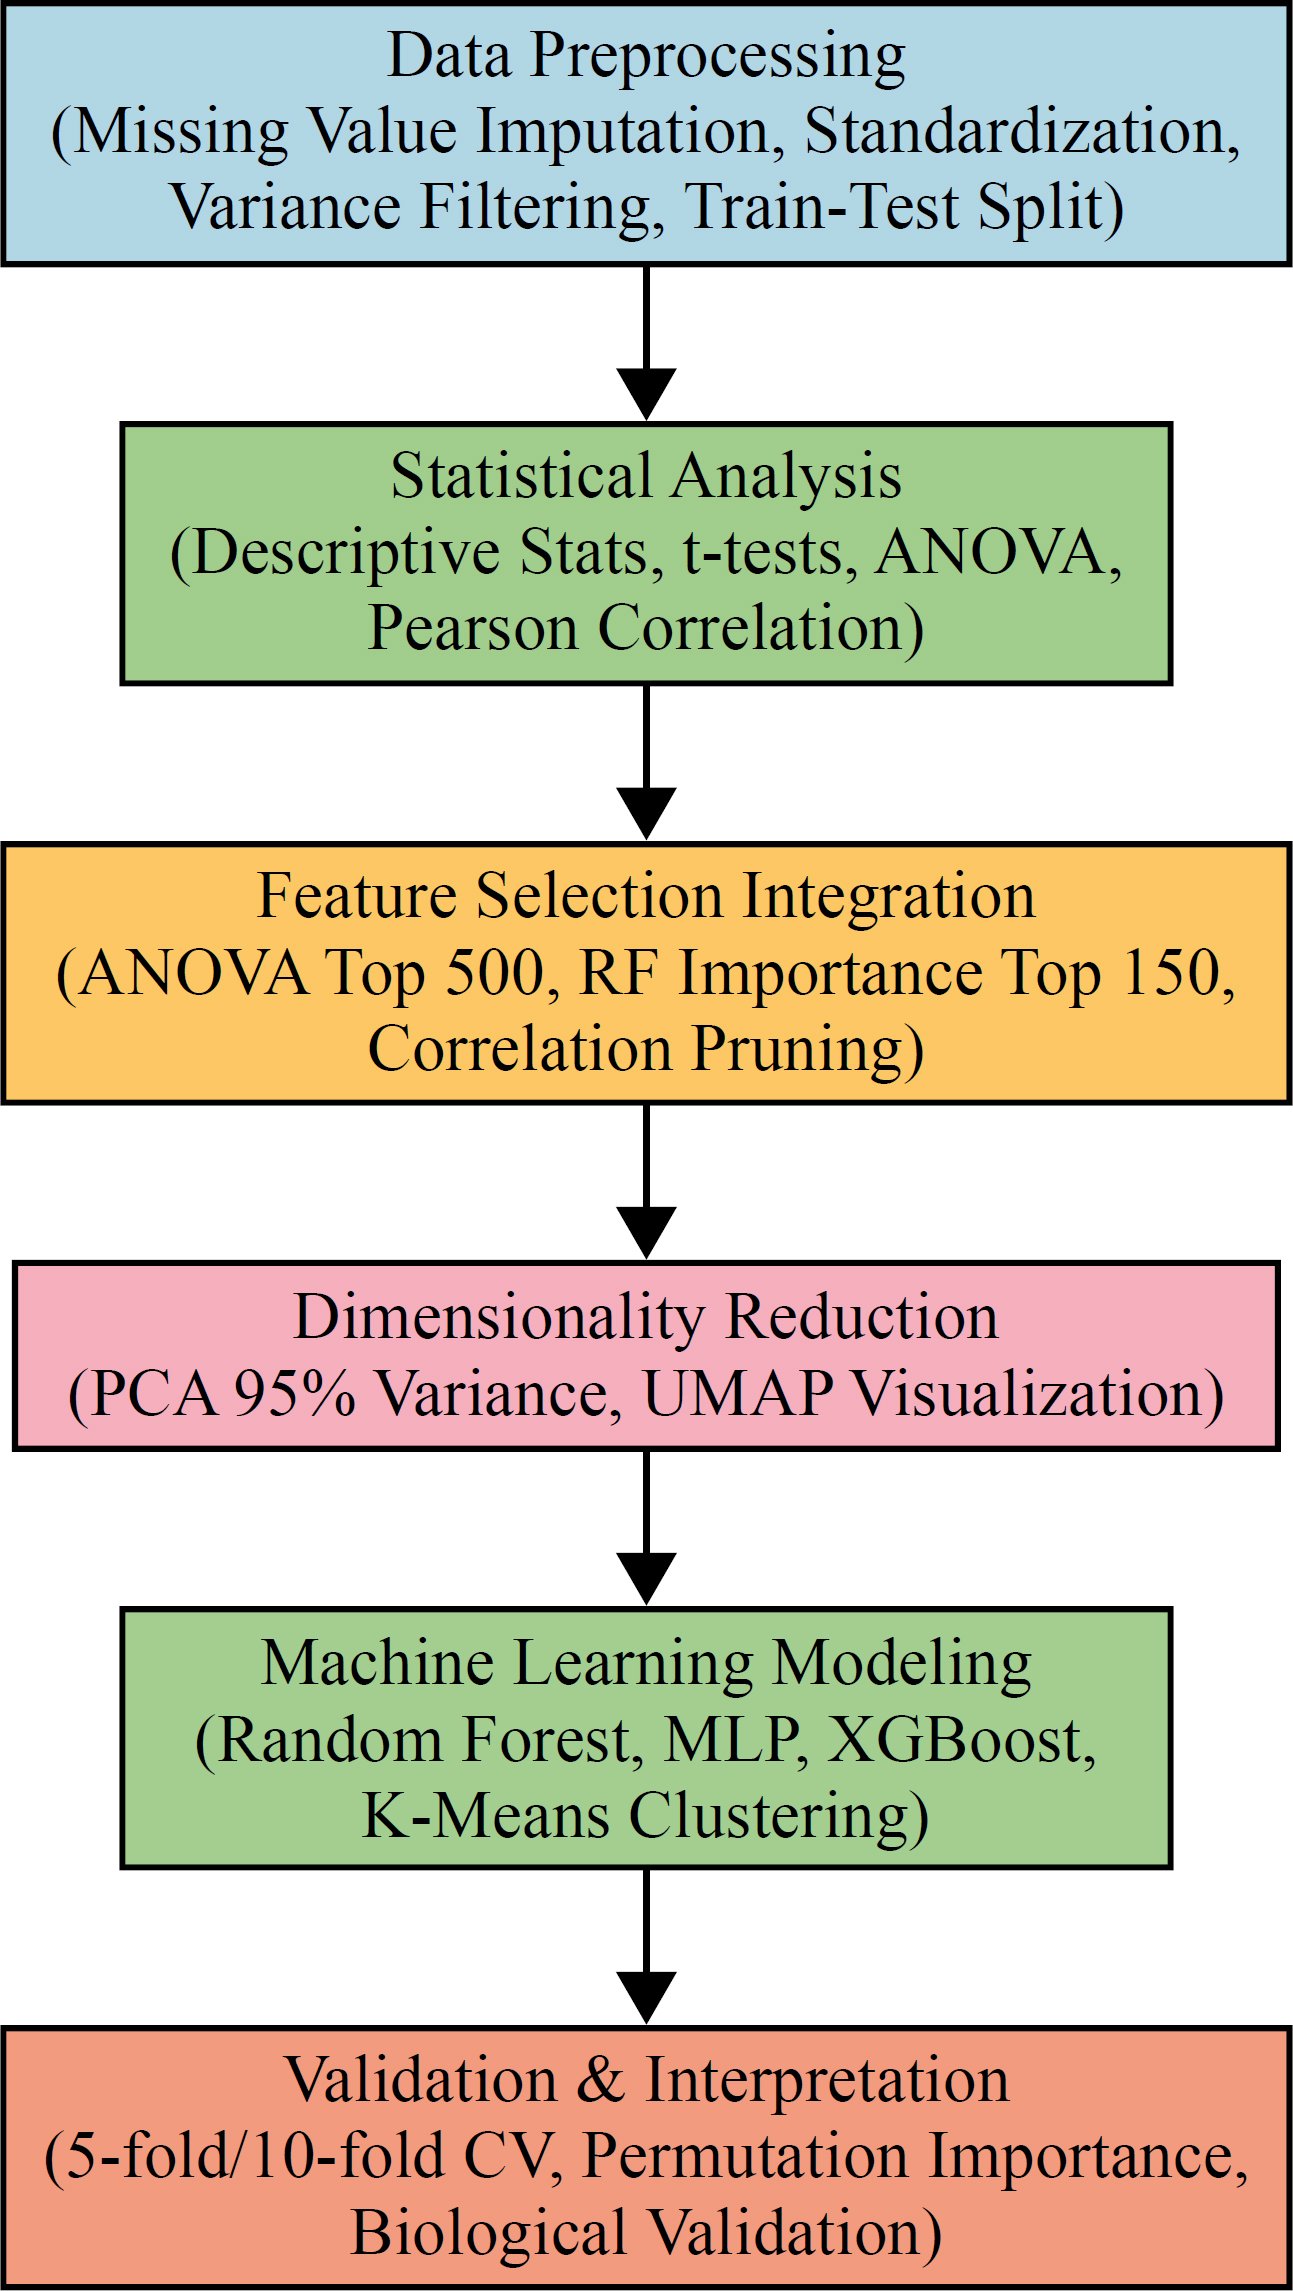
Fig. (1). Proposed methodology.
3.1. Dataset Description
This study used the publicly available METABRIC breast cancer gene-expression dataset. The original dataset contains approximately 1,904 patient records with gene-expression values and clinical variables, including age at diagnosis, cancer subtype, survival time, and cancer-related outcome information. However, the final modelling matrix differed from the raw dataset because preprocessing was applied before model training. Records with incomplete target labels were removed, survival-derived variables were excluded from model training to reduce information leakage, and class balancing was applied to address outcome imbalance. After preprocessing and balancing, the final supervised modelling dataset contained 2,565 observations, with a near-balanced distribution across the two binary outcome classes. The binary target variable was coded as 0 for alive or other outcomes and 1 for death due to cancer. The balanced modelling dataset was then divided using a stratified 80/20 train-test split, producing 2,052 training observations and 513 test observations.
3.2. Data Preprocessing
Data preprocessing is essential to make the METABRIC data suitable for analysis. Missing values were imputed using the median of respective numeric columns, maintaining data integrity and filling gaps. The outliers are detected and reduced in further normalization to avoid skewing of model performance. Outputs of Standard Scaler are normalized and made standard and converted into zero mean and unit variance, which refers to the value of the gene expression, and this is necessary in the ML algorithms that are sensitive to the differences in scales. Variance Threshold is used to filter by application of variance-based gene filtering to identify and eliminate low-variance features that carry less information. The final preprocessed and balanced modelling dataset was divided into training and test sets using a stratified 80/20 split. This produced 2,052 training observations and 513 test observations, with the test set containing 257 Class 0 cases and 256 Class 1 cases. Class imbalance was addressed before supervised model evaluation because the original METABRIC outcome distribution was not evenly balanced between the two target classes. A class-balancing procedure was applied to create a near-equal representation of Class 0 and Class 1 in the final modelling dataset. This step explains why the classification tables report a test-set support of 257 observations for Class 0 and 256 observations for Class 1, giving a total test support of 513. Therefore, the model evaluation tables should be interpreted as results from the preprocessed and balanced modelling dataset, rather than from the raw 1,904-sample dataset alone. Overall survival and survival months were excluded from model training and used only for exploratory statistical analysis. This step was applied to reduce information leakage because survival-derived variables are closely related to the outcome definition and may artificially inflate model performance.
3.3. Statistical Analysis
The preprocessing and feature selection stages rely on the statistical analysis, which gives a strict basis for further modelling by means of ML. Descriptive statistics, such as mean, variance and correlation matrices, are also calculated to summarize the dataset distribution and find the relationships between the features. Inferential statistics are used, which include t-tests and ANOVA, to identify significant genes that are statistically significant with death from cancer, and the p-value would be used to priorities features. Co-expression patterns are evaluated with the help of Pearson correlation analysis, which helps to comprehend the interactions between genes. To reduce the number of dimensions, Principal Component Analysis (PCA) can be used to keep 95 percent of the variance, which downsizes the feature space but still maintains essential information. Also, Uniform Manifold Approximation and Projection (UMAP) is applied during the visualization, allowing for the provision of a two-dimensional image of clusters of genes, interpreting them in an exploratory way.
3.4. Machine Learning Modelling
Machine Learning as the stage was applied both with supervised and unsupervised methods according to the goals of the study. Three classifiers were implemented for supervised prediction. The Random Forest model had 700 estimators with a maximum depth of 25 for a balance of predictive power and speed. To learn complex nonlinear relationships in the genomic data, the Multilayer Perceptron (MLP) with a hidden-layer configuration of 256–128–64 was employed. The XGBoost was used with 500 estimators and a learning rate of 0.03, and was appropriate for modelling high dimensional feature spaces. Unsupervised analysis was performed by applying 3 clusters to the K-Means algorithm for natural grouping exploration in the dataset and the silhouette score was used to measure the quality of clustering.
Feature selection was done in a staged process. First, the 500 features with highest statistical significance were retained by using ANOVA. The feature importance ranking using Random Forest was then performed to determine the top 150 most predictive variables. Finally, correlation-based pruning was carried out by setting the threshold to 0.90 to eliminate the most redundant features. The accuracy, precision, recall, F1 score, ROC-AUC were calculated to assess the performance of the classification and silhouette score was computed for clustering purposes.
3.5. Integration Framework
A proposed integration framework for filtering and feature prioritisation based on machine learning. The initial screening measure used was ANOVA p-values; the lower the p value, the more evidence of difference between the outcome groups. Not these p-values per se but the “feature space” was reduced for application of the Random Forest importance analysis using these p-values. This integrated approach enhanced the statistical reliability and predictive relevance.
The workflow started by cleaning and standardizing the data, then filtering the data using ANOVA and recursive feature elimination to remove uninformative variables. Then, principal component analysis was performed to reduce the dimensionality and to understand the structure of the transformed feature space. The features chosen were then used to train the machine learning models and the stability of the models was tested using 5-fold cross validation. The framework was able to address these challenges by implementing a combination of statistical screening, dimensionality reduction, machine-learning prediction, and validation, allowing for a balanced analysis of high-dimensional genomic data and noise reduction, while minimizing overfitting and maintaining interpretability.
3.6. Validation and Interpretation
Validation and interpretation are carried out for the reliability and the clinical relevance of the results of the framework. Both cross validations are performed: 5-fold used in the pipeline and 10-fold used in tuning the model for assessing the model’s generalization to the data subsets. Permutation importance is used to increase model interpretability, as it measures the value of each feature to model predictions by how much the model’s performance decreases with the shuffling of the features. This method clues the most significant genes filling the gap between predictive performance and biology. The second is biological interpretation, whereby the most likely genes are validated using the existing literature to ensure that they are relevant to the breast cancer pathways those that relate to survival outcome in particular and that the framework findings are based on known scientific data.
To meet computational efficiency, model stability and the ability to assess model generalisation, both 5-fold and 10-fold cross-validation were chosen. If there are more features than samples, it can be more challenging to prevent overfitting in high-dimensional genomic datasets. The use of 5-fold cross validation as the primary validation method was selected due to its practicality, as it offers a good compromise between the availability of training data and the rotation of the test sets but does not cause significant computational overhead. A 10-fold cross validation strategy was also pondered on model tuning, since it gives a more fine-grained estimation of the behaviour of the model with differing data partitions. Other validation methods were not considered, since they are computationally intensive and can be sensitive to high dimensionality. Likewise, repeated cross-validation can enhance the robustness, but will cost more in terms of computational requirement. Thus, 5-fold and 10-fold cross-validation were chosen as sensible and commonly used approaches for validation of machine learning models in the context of genomic data [11, 13].
4. RESULTS
The METABRIC dataset was analysed following missing-value imputation, standardisation, variance filtering and train-test splitting. Exploratory correlation between selected clinical data was found and later features with high redundancy were removed using correlation pruning before model construction. The dimensionality reduction was performed with PCA, keeping 95% of the total variance in the modelling pipeline. It has been assumed that the first 50 principal components (PC1-50) would be plotted in Fig. (3) which explained approximately 70% of the variance. K-Means cluster labels were used for exploratory visualisation using UMAP instead of binary outcome labels. For supervised classification, the best test accuracy was obtained by the MLP with a value of 0.9025, meanwhile, the best ROC-AUC value was obtained by the ensemble model with a value of 0.9660. The results indicated that supervised models performed better than the unsupervised clustering models for the binary cancer-death prediction task.
Fig. (2) presents the METABRIC correlation heat map of the different clinical features, ranging from strong positive correlation (e.g., patient_id and cohort (1.00)) to weaker negative correlation (e.g., chemotherapy and radio_therapy (-0.22)). The diagonal (1.00) is the line of perfect correlation with self and the colour gradient indicates the relationship of survival, treatment and tumour characteristics.
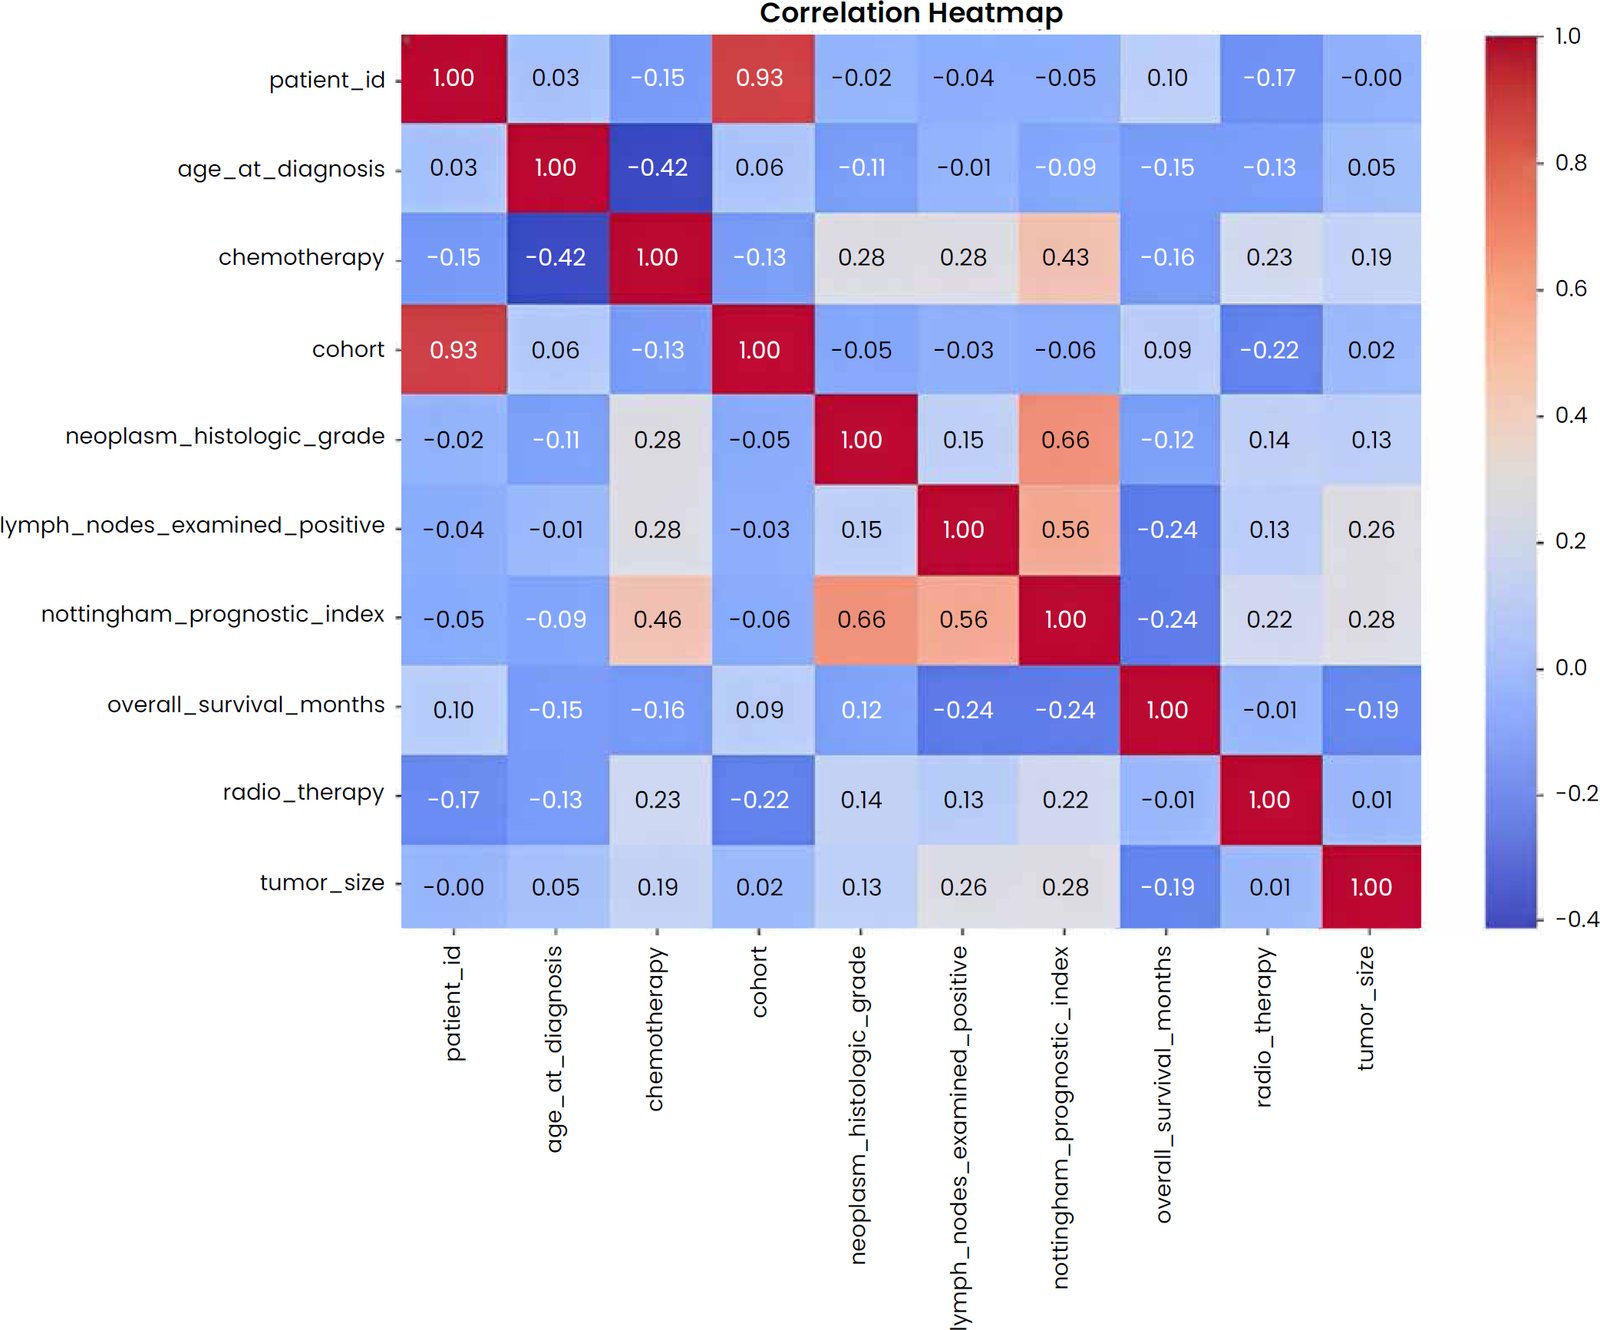
Fig. (2). Correlation heatmap.
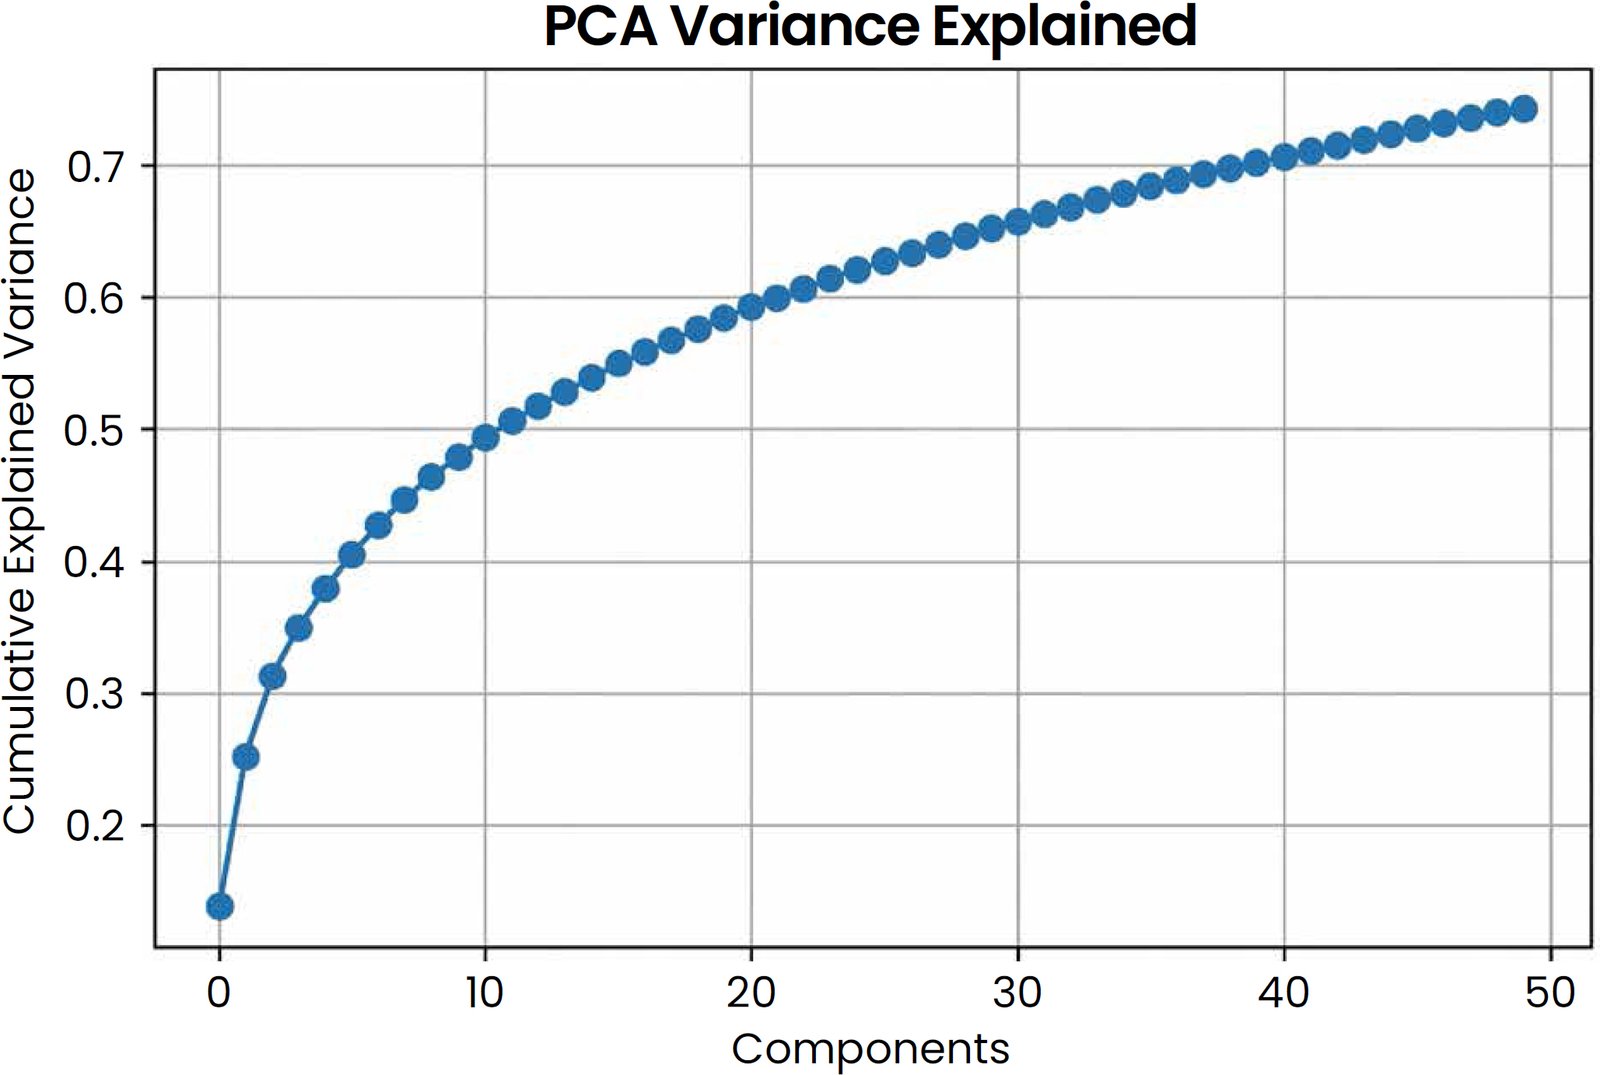
Fig. (3). PCA variance explained.
The cumulative percentage of variance accounted for by the first 50 principal components is shown in Fig. (3). About 70% of the variance was due to some of these components. In order to meet the requirement that the variance be within 95% of the variance threshold required by the modelling pipeline, more than the first 50 components had to be added. Thus, the early PCA trend (Fig. 3) represents a visualization of the PCA-retained feature space, not the entire PCA-retained feature space.
The top 200 gene-expression features were projected onto a UMAP (Fig. 4). Colors are not used to represent the classes (binary) to which the points belong, but the labels of the clusters to which the points have been assigned in the unsupervised learning K-means. Therefore the “Alive/Dead” outcome classes are not the labels, but exploratory clusters that were created using the K-Means algorithm. Where a death occurred, a binary classified supervised task was defined (death = 1 and other outcomes = 0). This differentiation is between exploratory clustering and supervised outcome prediction.
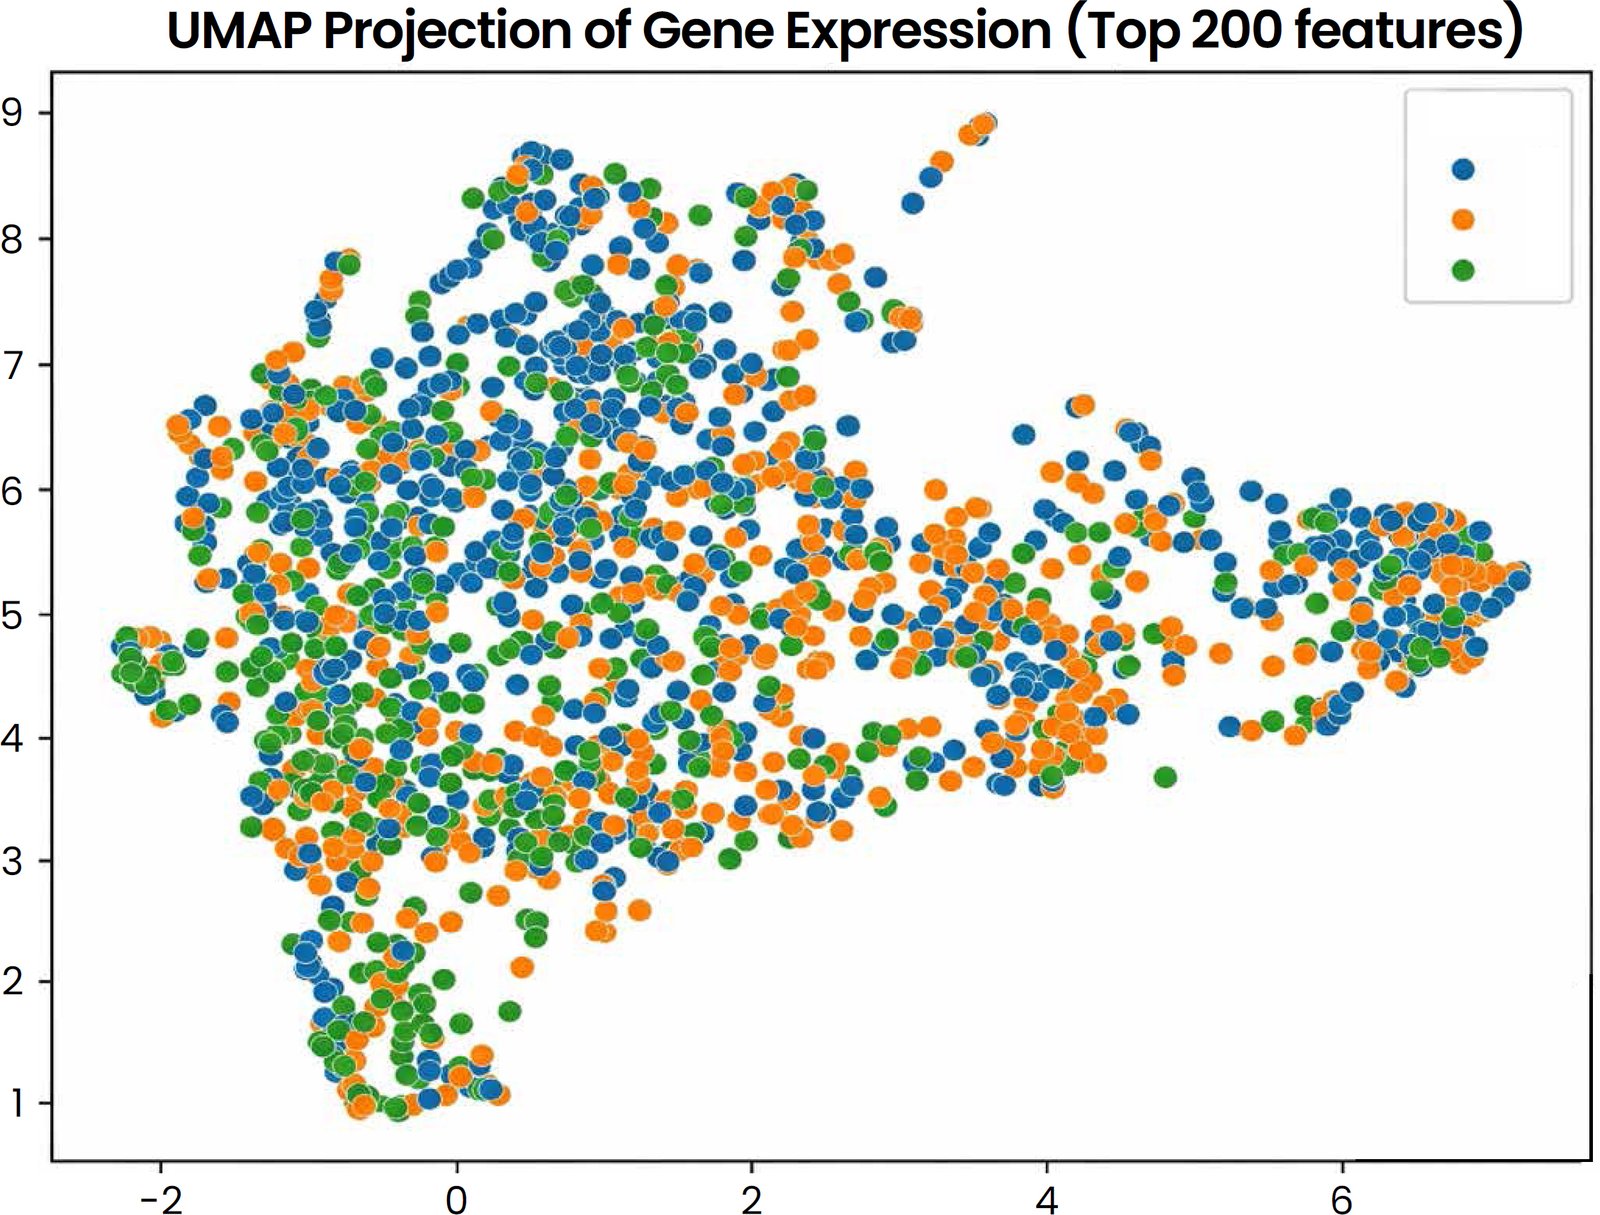
Fig. (4). UMAP projection of top 200 gene expression features.
For the METABRIC dataset, the silhouette score (0.0839) and mean accuracy (0.8517) of the K-Means clustering model and Random Forest model are presented in Table 1. The silhouette score is low, which indicates that the clusters are not well separated; the CV accuracy is high, which indicates a good model performance; this could indicate that the clustering and classification tasks are not equally well performed.
Table 1. Silhouette score and 5-fold CV accuracy results.
| Metric | Value |
| Silhouette Score | 0.0839 |
| 5-Fold CV Mean Accuracy | 0.8517 |
Table 2 shows the evaluation of the test set for a Random Forest model with an accuracy of 0.8694. For class 1 (256 samples) the precision, recall and f1 score are 0.89, 0.84 and 0.87, respectively and for macro/weighted average across 513 samples it is 0.87. This implies that a model is doing a good job, and that it has a similar predicting power on the binary classification task.
Table 2. Random forest test set evaluation metrics.
| Class/Metric | Precision | Recall | F1-score | Support |
| Class 0 | 0.8500 | 0.9000 | 0.8700 | 257 |
| Class 1 | 0.8900 | 0.8400 | 0.8700 | 256 |
| Accuracy | – | – | 0.8694 | 513 |
| Macro average | 0.8700 | 0.8700 | 0.8700 | 513 |
| Weighted average | 0.8700 | 0.8700 | 0.8700 | 513 |
Table 3 shows the evaluation of the test set for an MLP model that has an accuracy of 0.9025. It reports precision, recall, and F1-score of 0.94, 0.86, and 0.90 for class 0 (257 samples), and 0.87, 0.95, and 0.91 for class 1 (256 samples). The performance is very good and is well-balanced in the 513 samples (macro and weighted averages of 0.91 and 0.90 respectively).
Table 3. MLP test set evaluation metrics.
| Class/Metric | Precision | Recall | F1-score | Support |
| Class 0 | 0.9400 | 0.8600 | 0.9000 | 257 |
| Class 1 | 0.8700 | 0.9500 | 0.9100 | 256 |
| Accuracy | – | – | 0.9025 | 513 |
| Macro average | 0.9100 | 0.9000 | 0.9000 | 513 |
| Weighted average | 0.9100 | 0.9000 | 0.9000 | 513 |
The evaluation result of the test set of XGBoost model is displayed in Table 4, and the accuracy of the model is 0.8519. It reports precision, recall, and F1-score of 0.87, 0.83, and 0.85 for class 0 (257 samples), and 0.84, 0.87, and 0.85 for class 1 (256 samples). Evenness of the samples is even and the performance of the samples is regular in weighted averages (0.85) and macro averages (0.85).
Table 4. XGBoost test set evaluation metrics.
| Class/Metric | Precision | Recall | F1-score | Support |
| Class 0 | 0.8700 | 0.8300 | 0.8500 | 257 |
| Class 1 | 0.8400 | 0.8700 | 0.8500 | 256 |
| Accuracy | – | – | 0.8519 | 513 |
| Macro average | 0.8500 | 0.8500 | 0.8500 | 513 |
| Weighted average | 0.8500 | 0.8500 | 0.8500 | 513 |
The accuracy of Ensemble Model is 0.8947 as shown in Table 5. It reports precision, recall, and F1-score of 0.92, 0.86, and 0.89 for class 0 (257 samples), and 0.87, 0.93, and 0.90 for class 1 (256 samples). The 513 samples give very good balanced performance for macro and weighted averages (0.89).
Table 5. Ensemble model test set evaluation metrics.
| Class | Precision | Recall | F1-score | Support |
| 0 | 0.9200 | 0.8600 | 0.8900 | 257 |
| 1 | 0.8700 | 0.9300 | 0.9000 | 256 |
| Accuracy | – | – | 0.8947 | 513 |
| Macro avg | 0.900 | 0.8900 | 0.8900 | 513 |
| Weighted avg | 0.9000 | 0.8900 | 0.8900 | 513 |
Fig. (5) compares the ROC curves of the Random Forest, MLP, XGBoost and ensemble models. The ensemble model performed best with an ROC-AUC score of 0.9660, MLP scored 0.9570, Random Forest scored 0.9510 and XGBoost scored 0.9460. As can be seen in this figure, the performance of all models were good in discrimination between the two classes with the best overall class discrimination performance by ensemble model.
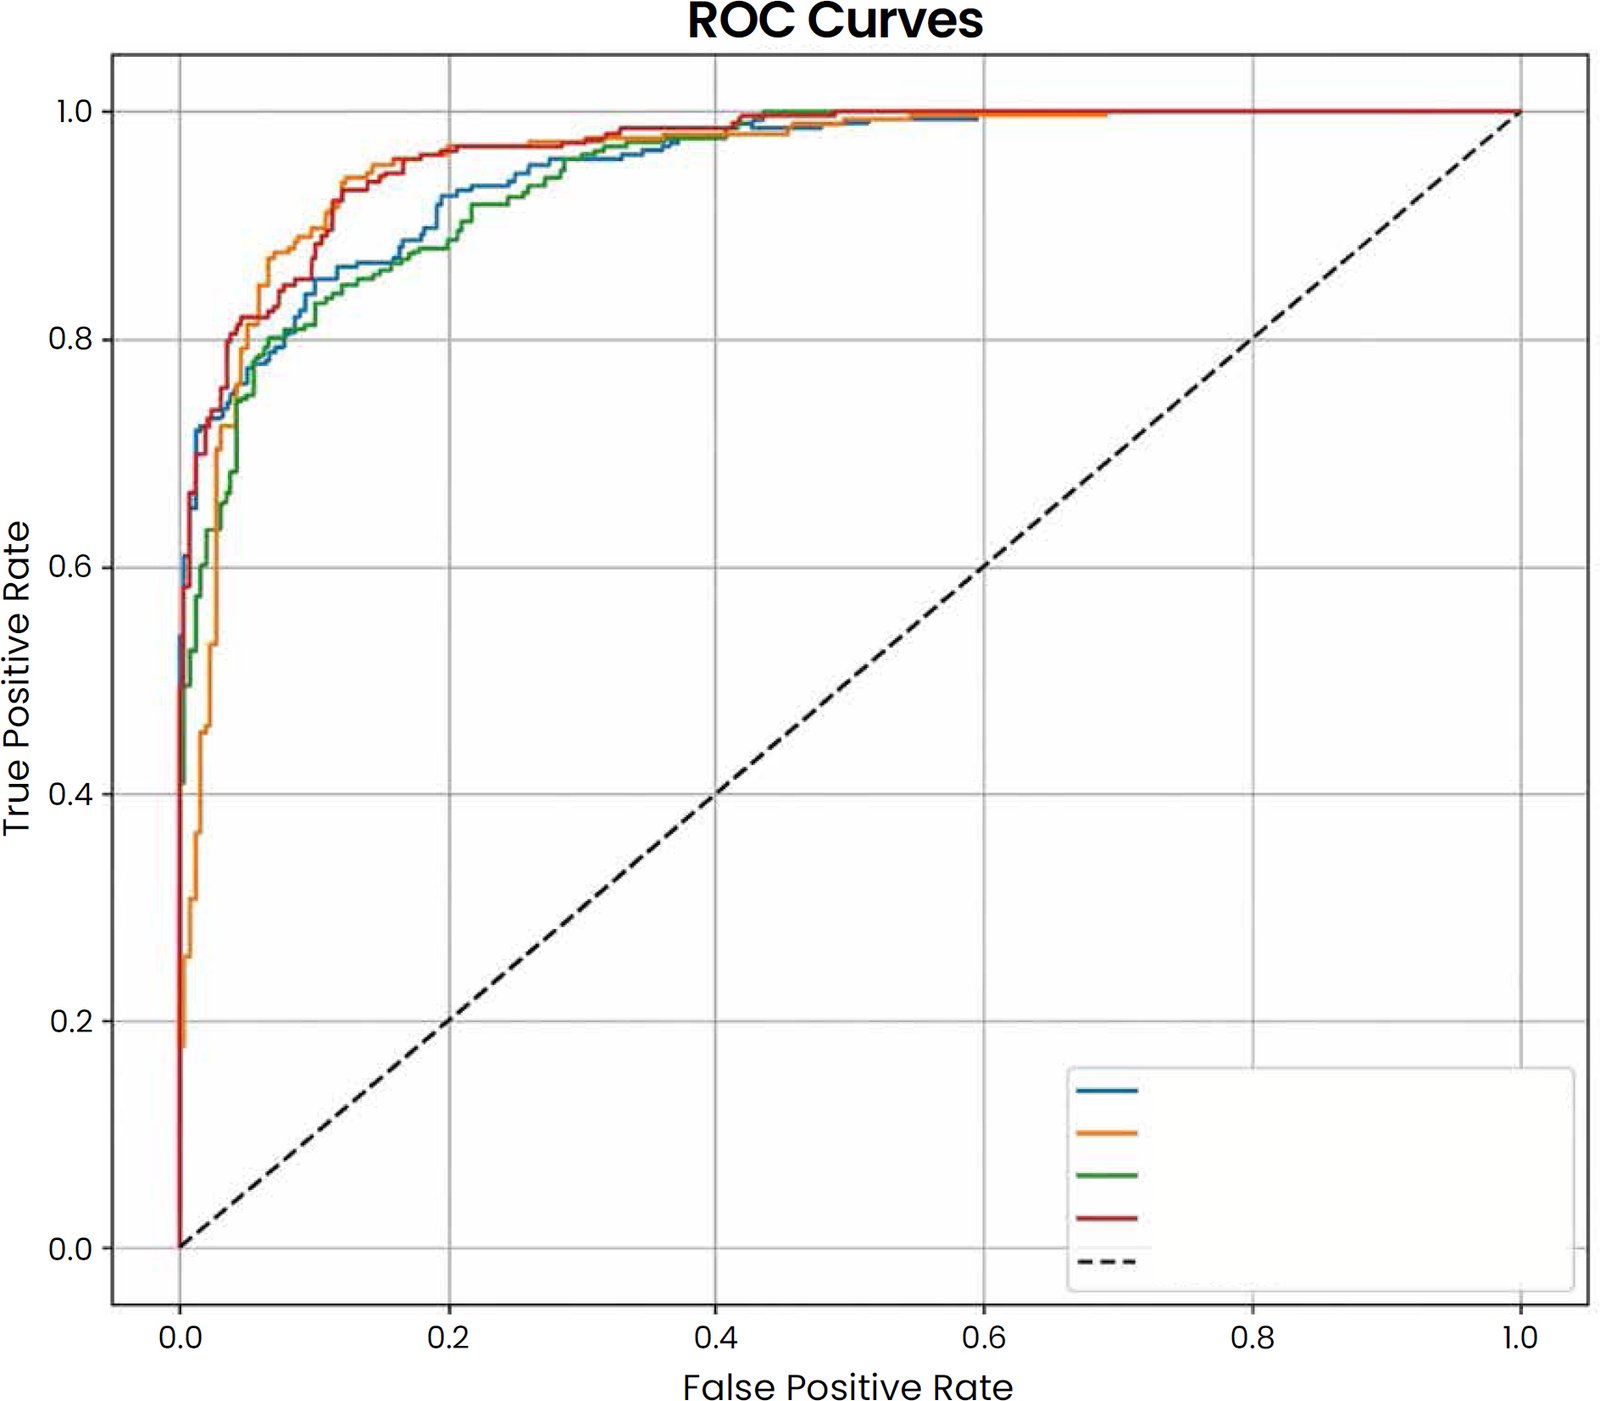
Fig. (5). ROC curves for model performance comparison.
The t-statistics (and p-values) for the most important features prior to PCA are shown in Table 6. The overall survival (t-stats = 46.22, pval = 4.10e-275) and overall survival months (t-stats = 22.65, pval = 1.10e-97) are significant. Statistically, other characteristics are also highly significant (p < 0.05) and are important in distinguishing between classes in the METABRIC data set: Nottingham Prognostic Index and the presence of positive lymph node examination.
Table 6. T-test results for top features before PCA.
| Feature | T-statistic | p-value |
| overall_survival | 46.2169 | 4.10e-275 |
| overall_survival_months | 22.6548 | 1.10e-97 |
| nottingham_prognostic_index | −12.0543 | 1.19e-31 |
| aurka | −9.4018 | 2.44e-20 |
| lymph_nodes_examined_positive | −9.1271 | 5.38e-19 |
| tumour_stage | −8.0477 | 2.20e-15 |
| e2f2 | −7.4442 | 1.77e-13 |
| gsk3b | −7.2577 | 7.07e-13 |
| fancd2 | −6.9735 | 5.10e-12 |
| tumour_size | −6.9856 | 5.42e-12 |
Fig. (6) shows a Model Accuracy Comparison bar chart. The accuracy of MLP is the highest (~0.9) followed by Ensemble, Random Forest and XGBoost which are around 0.85-0.88. The bars show that the model MLP is better than the other models, indicating that it is a better fit for the data. All models show high accuracy, sign of good performance in classification task of the METABRIC dataset.
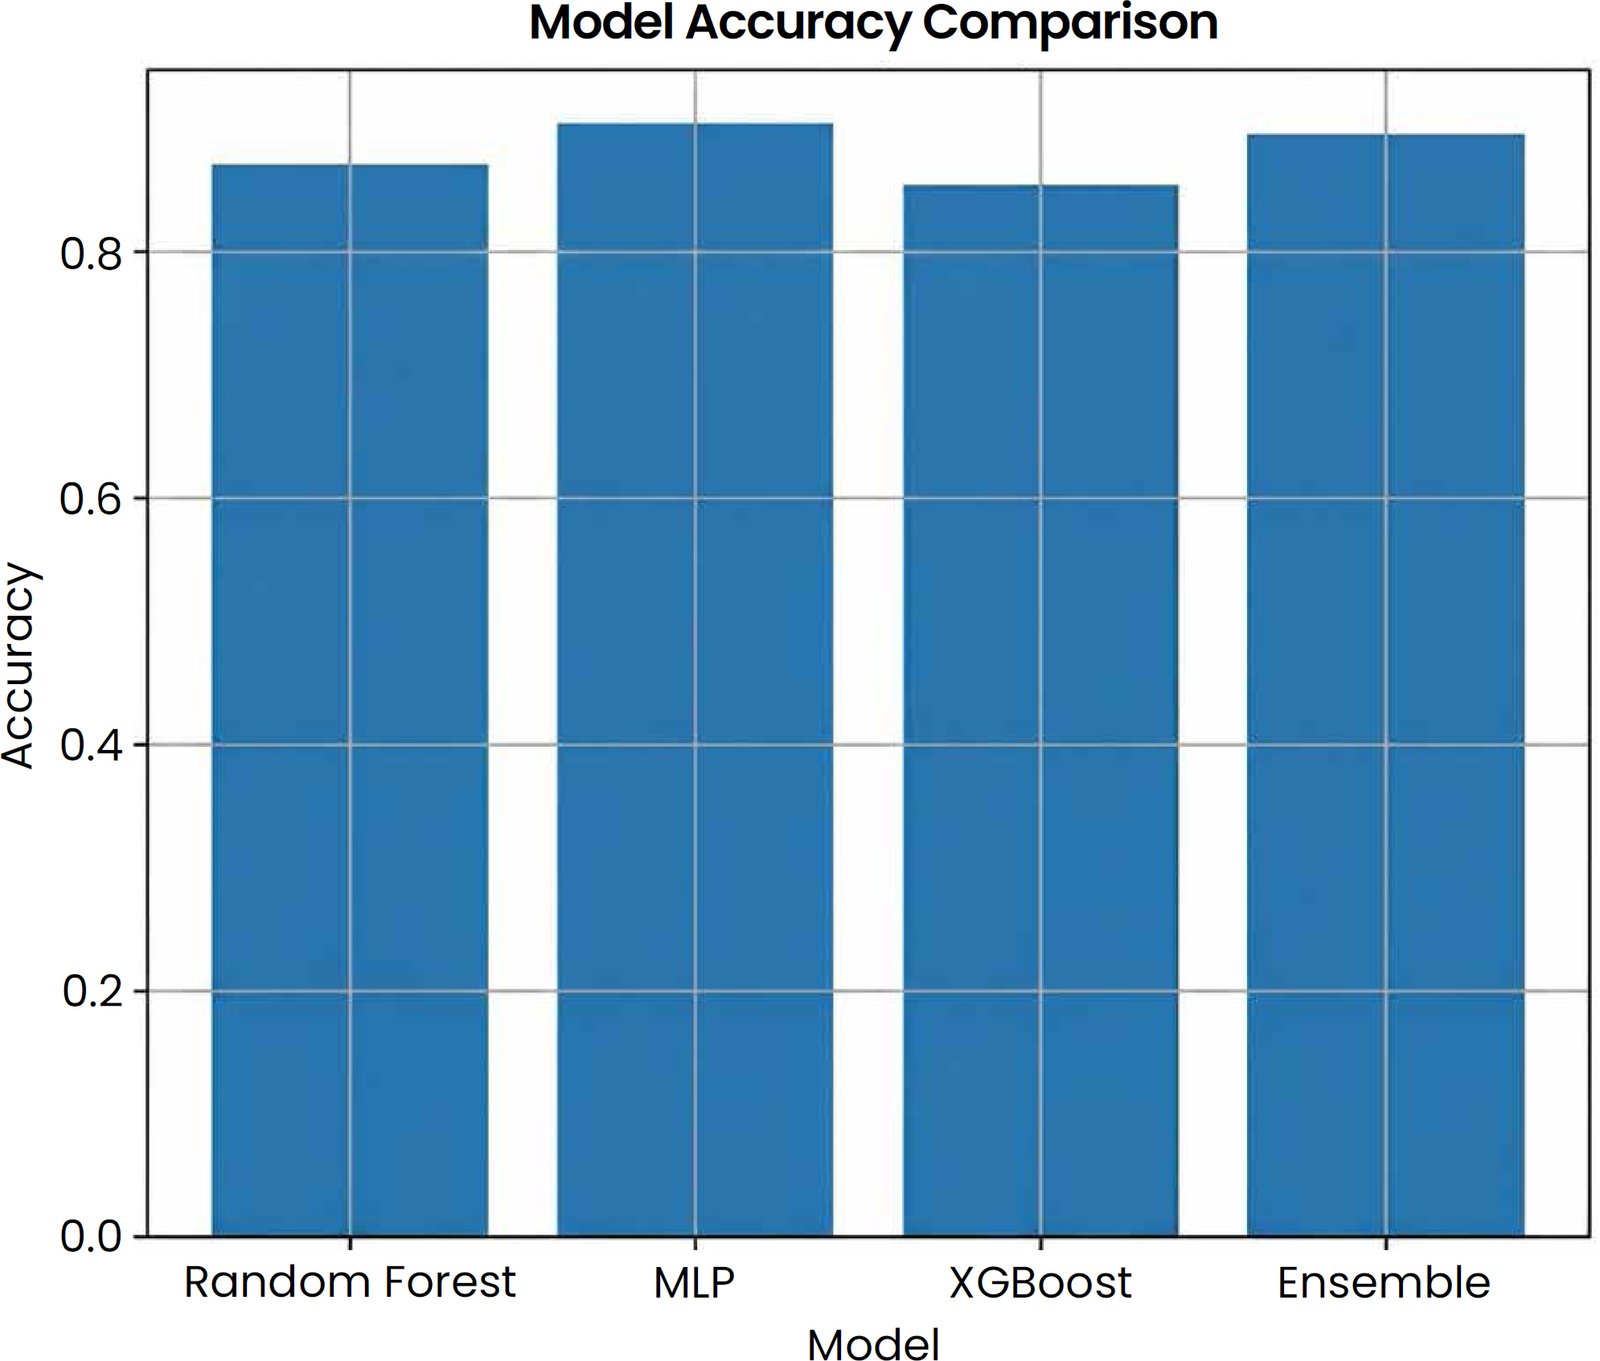
Fig. (6). Comparison of model accuracies.
The ANOVA results for the PCA are presented in Table 7. The ANOVA F values are consistent with the corresponding results for the two-group t test because the classification was binary. Lower p-values for ANOVA mean that the evidence for significant difference between the two outcome groups is more convincing. OS and OM were only included for exploratory statistical interpretation and were not included for model development (information leakage). Survival-derived variables were excluded from feature-selection procedures used for model development and are reported only for exploratory statistical interpretation.
Table 7. ANOVA results for features before PCA.
| Feature | F-statistic | ANOVA p-value |
| overall_survival | 2136.0000 | 4.10e-275 |
| overall_survival_months | 513.2414 | 1.10e-97 |
| nottingham_prognostic_index | 145.3068 | 1.19e-31 |
| aurka | 88.3933 | 2.44e-20 |
| lymph_nodes_examined_positive | 83.3042 | 5.38e-19 |
| tumour_stage | 64.7652 | 2.20e-15 |
| e2f2 | 55.4162 | 1.77e-13 |
| gsk3b | 52.6749 | 7.07e-13 |
| fancd2 | 48.6292 | 5.10e-12 |
| tumour_size | 48.7990 | 5.42e-12 |
5. DISCUSSION
The hybrid framework showed good predictive performance, however, it was not found to be significantly more accurate than all individual models at 5-10% improvement. The highest test accuracy was obtained by the MLP model and the highest ROC-AUC was obtained by the ensemble model. This indicates the ensemble model did not perform better on simple accuracy, but it did perform better on class discrimination capability. The usefulness of the proposed framework is that it brings together a set of statistical feature screening, machine learning feature ranking, dimensionality reduction, model comparison, and permutation-based model interpretation into a single structured framework. This enhances analytical reliability and biological interpretability, but not necessarily because of a large increase in accuracy compared to each individual model. The hybrid solution also reduces these drawbacks by using statistical preprocessing to minimize noise in the data and then applying ML to learn complex trends in the data while maintaining competitive predictive performance across multiple modelling approaches [9].
The ensemble model showed only a moderate improvement compared with the individual machine learning models. However, this improvement remains important because the ensemble achieved the highest ROC-AUC, indicating stronger class-discrimination ability rather than only higher accuracy. In genomic prediction tasks, even a small performance gain can be meaningful when it is accompanied by improved stability and reduced dependence on a single model structure. Random Forest, MLP, and XGBoost capture different patterns in the data: Random Forest handles feature interactions and multicollinearity, MLP captures non-linear relationships, and XGBoost improves gradient-based decision boundaries. The ensemble model combines these strengths and reduces the likelihood that prediction depends on the limitations of one model. Therefore, the justification for using the ensemble model is not based only on a large accuracy increase, but on its more balanced discrimination, robustness, and suitability for complex high-dimensional genomic data [10–12].
On a biological level, the identified genes and clinical prognostic variables are also strongly associated with the prognostic pathways in breast cancer, which is consistent with the results of [13, 14]. The validated genes, t-test, and permutation are essential and associated with survival-based processes, increasing the framework’s clinical applicability. This agreement with the available literature highlights the possibility of the hybrid model to identify biologically relevant markers, which can inform the process of cancer progression that other methods would not consider [15, 16]. The findings have important implications for precision medicine and bioinformatics, especially regarding biomarker discovery. The framework aids personalized treatment plans by determining the key genes associated with survival rates. Its interpretability through permutation importance is also helpful in bioinformatics research by helping to translate genomic information into practical clinical results, thereby helping to develop therapeutic solutions.
The study presents a hybrid ML-statistical framework tested on the METABRIC dataset by combining statistical screening, machine learning-based feature ranking, dimensionality reduction, supervised classification, unsupervised clustering, and permutation-based interpretation within a single analytical workflow [17]. Theoretically, the framework offers high-dimensional genomic data and a generalizable model relevant to the methodological gap between statistical inference and ML prediction. This two-facet method, which has been confirmed by [17], provides a scalable mechanism to be applied in future genomic processes. However, its shortcomings are its binary outcome focus, and multi-omics integration in the future is suggested to broaden its scope [18]. A further methodological consideration is the potential risk of information leakage from survival-derived variables. Variables such as overall survival and overall survival months may be strongly linked to the outcome definition and could therefore increase apparent classification performance if included directly in model training. Model performance should be assessed in future versions of the framework with and without survival-derived variables to ensure that the predictive signal is due to independent genomic variables and not outcome-proximal clinical variables. This sensitivity analysis would further validate and repeat the proposed pipeline clinically in terms of validity and reproducibility.
IMPLICATION AND LIMITATION
The findings have practical implications for genomic research, biomarker discovery, and precision medicine. In the genomic industry, high-dimensional datasets are commonly used to support cancer prognosis, patient stratification, drug-response prediction, and clinical decision-support development. The proposed ensemble-based hybrid framework can support these activities by ranking biologically relevant features, reducing noise, and improving the reliability of predictive modelling. Its main role is not to replace clinical judgement, but to provide a reproducible analytical pipeline that can assist researchers and bioinformatics teams in identifying candidate biomarkers and prioritising variables for further laboratory or clinical validation. The framework may also help genomic companies and clinical research organisations develop more interpretable AI-assisted tools for cancer outcome prediction. However, before clinical deployment, the model should be externally validated on independent breast cancer cohorts and tested with multi-omics data such as proteomics, methylation, and metabolomics. One limitation of the modelling design is that class balancing changes the distribution of the original METABRIC dataset. Although balancing improves model training and prevents the classifier from being biased toward the majority class, it may also reduce direct comparability with the raw clinical population. Therefore, the reported test-set support values reflect the balanced modelling dataset rather than the original METABRIC distribution. Future work should report results on both the original imbalanced test set and the balanced modelling set to confirm whether model performance remains stable under real-world class distributions.
CONCLUSION
The paper introduced a joint machine learning (ML) statistical pipeline on the METABRIC data set, a significant advancement in high-dimensional genomic data analysis. The framework is more successful in classification with an AUC of 0.9660 and an approximation accuracy of 0.8947 and is more interpretable with the assistance of permutation importance. It could also detect biologically relevant genes together with known clinical prognostic indicators, which is a marker of breast cancer outcomes) and the ones that are consistent with known prognostic pathways with statistical preprocessing (e.g., ANOVA) and scalability with ML (e.g., XGBoost). These findings point to the ability of the pipeline to extract actionable information from the multidimensional genomic data, which is neither predictive nor clinical. The work has threefold contributions; it introduces a new hybrid pipeline that can satisfy the demands of high-dimensional genomics, provides a practical example of interpretable ML in the bioinformatics domain, and provides a theoretical breakthrough in the capacity of statistical rigour and scalability of ML. The gaps in the former one-method studies are bridged by this technique, which offers a generalizable approach validated on METABRIC.
This study therefore contributes a methodological framework rather than a new dataset. Its value lies in demonstrating how statistical validation and machine learning prediction can be combined to improve interpretability and predictive performance in high-dimensional genomic analysis. The ensemble model plays an important role by providing stronger class-discrimination performance and greater modelling stability, which are important for genomic applications where prediction reliability and biological explanation are both required. The future research can continue with multi-omics data, such as proteomics and metabolomics, to gain a larger biological image. Several strategies would help improve representation learning and find more patterns, including applying deep learning techniques, e.g., auto encoders and Graph Neural Networks (GNNs). Finally, one could convert these discoveries into clinical decision support systems and provide customized medicine, where the identified biomarkers can be exploited to enhance patient outcomes. This article constitutes a radical background to these further studies in genomics.
LIST OF ABBREVIATIONS
|
ML |
= |
Machine Learning |
|
MLP |
= |
Multilayer Perceptron |
|
METABRIC |
= |
Molecular Taxonomy of Breast Cancer International Consortium |
|
PCA |
= |
Principal Component Analysis |
|
ROC-AUC |
= |
Receiver Operating Characteristic Area Under the Curve |
|
UMAP |
= |
Uniform Manifold Approximation and Projection |
|
XGBoost |
= |
Extreme Gradient Boosting |
AUTHORS’ CONTRIBUTIONS
Z.K. conceived and designed the study, developed the proposed framework, supervised the research methodology, interpreted the results, and drafted and revised the manuscript. M.S. acquired and preprocessed the dataset, performed the statistical analyses and machine learning experiments, evaluated the results, and contributed to manuscript revision. H.M. assisted with data analysis, validated the findings, reviewed the methodology, provided critical feedback, and approved the final version of the manuscript. All authors read and approved the final version of the manuscript.
ETHICAL APPROVAL & INFORMED CONSENT
Not applicable.
AVAILABILITY OF DATA AND MATERIALS
The dataset analyzed during the current study is publicly available through the Molecular Taxonomy of Breast Cancer International Consortium (METABRIC) repository. The METABRIC dataset contains genomic and associated clinical data for breast cancer patients and can be accessed through authorized public data repositories, subject to their respective data access policies. No new datasets were generated during the current study.
FUNDING
None.
CONFLICT OF INTEREST
The authors declare that there are no competing interests or conflicts of interest relevant to the content of this work.
ACKNOWLEDGEMENTS
Declared none.
DECLARATION OF AI
During the preparation of this manuscript, the authors utilized ChatGPT to assist with language refinement and editorial improvements. All AI-assisted content was carefully reviewed, verified, and edited by the authors, who accepts full responsibility for the accuracy, integrity, and final content of the manuscript.
REFERENCES
[1] K. Borah, H. S. Das, S. Seth, K. Mallick, Z. Rahaman, and S. Mallik, “A review on advancements in feature selection and feature extraction for high-dimensional NGS data analysis,” Funct. Integr. Genomics, vol. 24, no. 5, Art. no. 139, 2024,
https://doi.org/10.1007/s10142-024-01415-x
[2] G. Dimitrov, M. Atanasova, Y. Popova, K. Vasileva, Y. Milusheva, and P. Troianova, “Molecular and genetic subtyping of breast cancer: The era of precision oncology,” World Cancer Res. J., vol. 9, Art. no. e2367, 2022,
https://doi.org/10.32113/wcrj_20227_2367
[3] J. Wang, “Biostatistical Challenges in High-Dimensional Data Analysis: Strategies and Innovations,” Comput. Mol. Biol., vol. 14, no. 4, 2024,
https://doi.org/10.5376/cmb.2024.14.0019
[4] T. Mahama, “Training ensemble classifiers on genomic data to forecast personalized cancer treatment response probabilities,” Int. J. Res. Publ. Rev., vol. 6, no. 6, pp. 722-736, 2025, Available from: https://ijrpr.com/uploads/V6ISSUE6/IJRPR47609.pdf
[5] A. Mahmoud, M. Alhussein, K. Aurangzeb, and E. Takaoka, “Breast Cancer Survival Prediction Modelling Based on Genomic Data: An Improved Prognosis-Driven Deep Learning Approach,” IEEE Access, vol. 12, pp. 119502-119519, 2024,
https://doi.org/10.1109/ACCESS.2024.3449814
[6] R. Vitorino, “Transforming clinical research: The power of high-throughput omics integration,” Proteomes, vol. 12, no. 3, Art. no. 25, 2024,
https://doi.org/10.3390/proteomes12030025
[7] K. M. M. Uddin, A. Al Mamun, A. Chakrabarti, R. Mostafiz, and S. K. Dey, “An ensemble machine learning-based approach to predict cervical cancer using hybrid feature selection,” Neurosci. Inform., vol. 4, no. 3, Art. no. 100169, 2024,
https://doi.org/10.1016/j.neuri.2024.100169
[8] A. Acharjee, J. Larkman, Y. Xu, V. R. Cardoso, and G. V. Gkoutos, “A random forest-based biomarker discovery and power analysis framework for diagnostics research,” BMC Med. Genomics, vol. 13, no. 1, Art. no. 178, 2020,
https://doi.org/10.1186/s12920-020-00826-6
[9] S. Asif, Y. Wenhui, S. ur-Rehman, Q. ul-ain, K. Amjad, Y. Yueyang, J. S. Jinhai, and M. Awais, “Advancements and prospects of machine learning in medical diagnostics: Unveiling the future of diagnostic precision,” Arch. Comput. Methods Eng., vol. 32, no. 2, pp. 853-883, Mar. 2025,
https://doi.org/10.1007/s11831-024-10148-w
[10] D. S. Watson, “Interpretable machine learning for genomics,” Hum. Genet., vol. 141, no. 9, pp. 1499-1513, 2022,
https://doi.org/10.1007/s00439-021-02387-9
[11] M. D. Ganggayah, N. A. Taib, Y. C. Har, P. Lio, and S. K. Dhillon, “Predicting factors for survival of breast cancer patients using machine learning techniques,” BMC Med. Inform. Decis. Mak., vol. 19, no. 1, Art. no. 48, 2019,
https://doi.org/10.1186/s12911-019-0801-4
[12] J. Rahnenführer, R. De Bin, A. Benner, F. Ambrogi, L. Lusa, A. L. Boulesteix, E. Migliavacca, H. Binder, S. Michiels, W. Sauerbrei, and L. McShane, “Statistical analysis of high-dimensional biomedical data: A gentle introduction to analytical goals, common approaches and challenges,” BMC Med., vol. 21, no. 1, Art. no. 182, 2023,
https://doi.org/10.1186/s12916-023-02858-y
[13] W. Chen, S. J. Morabito, K. Kessenbrock, T. Enver, K. B. Meyer, and A. E. Teschendorff, “Single-cell landscape in mammary epithelium reveals bipotent-like cells associated with breast cancer risk and outcome,” Commun. Biol., vol. 2, no. 1, Art. no. 306, 2019,
https://doi.org/10.1038/s42003-019-0554-8
[14] C. Curtis, S. P. Shah, S. F. Chin, G. Turashvili, O. M. Rueda, M. J. Dunning, D. Speed, A. G. Lynch, S. Samarajiwa, Y. Yuan, et al., “The genomic and transcriptomic architecture of 2,000 breast tumours reveals novel subgroups,” Nature, vol. 486, pp. 346-352, 2012,
https://doi.org/10.1038/nature10983
[15] B. Pereira, S. F. Chin, O. M. Rueda, H. K. Vollan, E. Provenzano, H. A. Bardwell, M. Pugh, L. Jones, R. Russell, S. J. Sammut, et al., “The somatic mutation profiles of 2,433 breast cancers refine their genomic and transcriptomic landscapes,” Nat. Commun., vol. 7, Art. no. 11479, May 2016,
https://doi.org/10.1038/ncomms11479
[16] The Cancer Genome Atlas Network, “Comprehensive molecular portraits of human breast tumours,” Nature, vol. 490, no. 7418, pp. 61-70, 2012,
https://doi.org/10.1038/nature11412
[17] A. Herath, Z. Kobti, “Multimodal Contrastive Clustering: Deep Unsupervised Learning Approach for Cancer Subtype Discovery with Multi-omics Data,” Procedia Comput. Sci., vol. 246, pp. 696-705, 2024,
https://doi.org/10.1016/j.procs.2024.09.488
[18] J. Vamathevan, D. Clark, P. Czodrowski, I. Dunham, E. Ferran, G. Lee, B. Li, A. Madabhushi, P. Shah, M. Spitzer, and S. Zhao, “Applications of machine learning in drug discovery and development,” Nat. Rev. Drug Discov., vol. 18, pp. 463-477, 2019,
https://doi.org/10.1038/s41573-019-0024-5