


- ABSTRACT:
- 1. INTRODUCTION
- 2. LITERATURE REVIEW
- 3. METHODOLOGY
- 4. RESULTS
- 5. DISCUSSION
- LIMITATIONS AND FUTURE DIRECTION
- CONCLUSION
- LIST OF ABBREVIATIONS
- AUTHOR'S CONTRIBUTION
- ETHICAL APPROVAL & INFORMED CONSENT
- AVAILABILITY OF DATA AND MATERIALS
- FUNDING
- CONFLICT OF INTEREST
- ACKNOWLEDGEMENTS
- DECLARATION OF AI
- REFERENCES
Article ID: PD2601204002
Views: 790A Reproducible Statistical and Explainable Machine Learning Workflow for Small Corrosion Datasets: Methodological Demonstration Using Measured Weight-Loss and Synthetic Corrosion-Rate Data
 PDF
PDF
⬇ Downloads: 27
1Institute of Minerals & Materials Technology, Council of Scientific and Industrial Research, Bhubaneswar, India
Received: 17 July, 2026
Accepted: 16 September, 2026
Revised: 08 September, 2026
Published: 29 September, 2026
ABSTRACT:
Introduction: Corrosion is a major industrial challenge associated with substantial economic, structural-safety, and environmental consequences. This study presents a reproducible statistical and explainable machine-learning workflow for analysing small corrosion datasets using a limited measured weight-loss dataset and a separately generated synthetic corrosion-rate dataset for methodological demonstration. The objective of this study is not to establish experimentally validated Cu/Ni/Cr coating performance, but to demonstrate how statistical inference, predictive modelling, and explainable artificial intelligence approaches can be integrated within a transparent analytical workflow for data-scarce corrosion research.
Methodology: The measured source contains exposure days and bare/coated specimen weights; therefore, cumulative mass loss and protection efficiency were derived directly, while measured corrosion rate in mm/year could not be calculated because specimen density and exposed area were not available. The measured coated specimen is generic and cannot be identified as Cu, Ni, or Cr. For synthetic modelling, coating type was represented using OneHotEncoder to avoid artificial ordinal coding.
Results: One-way ANOVA confirmed strong separation among the predefined synthetic coating distributions (F = 744.717, p = 2.524 × 10⁻⁶⁶, η² = 0.9588). In five-fold cross-validation, Linear Regression achieved the highest mean CV R² (0.9517; RMSE = 0.0334), while tuned XGBoost achieved the strongest held-out test performance among the tuned models (R² = 0.9175, RMSE = 0.0384, MAE = 0.0253). Random Forest feature importance was distributed across one-hot coating indicators, led by Coating_Bare (0.9553). Aggregated SHAP analysis showed that coating category accounted for 0.9809 of relative mean absolute SHAP importance and exposure days for 0.0191 within the synthetic construction. Measured Day-60 protection efficiency was 88.89%, compared with a synthetic mean relative protection of 73.52%, a descriptive gap of 15.37 percentage points.
Conclusion: These findings demonstrate the reproducibility of the analytical workflow only and should not be interpreted as evidence of experimentally validated Cu/Ni/Cr corrosion performance or direct corrosion-rate prediction capability. Experimental validation using independently measured Cu/Ni/Cr coating datasets was beyond the scope of the present methodological demonstration and represents the principal next step required for future application of the proposed workflow.
Keywords: Corrosion inhibition, nanostructured coatings, machine learning, statistical analysis, Kaggle dataset, SHAP explainability, industrial applications.
1. INTRODUCTION
Corrosion is a serious industrial problem and is responsible for annual economic losses of about US$2.5 trillion (or 3–4% of the world’s GDP) and endangers critical infrastructure like pipelines, bridges and offshore platforms [1]. This general electrochemical process may promote deterioration of the materials and may lead to environmental contamination via the evolution of metallic species and corrosion products, making it even more important to adopt effective and sustainable protection measures [2]. Environmental factors like humidity, salinity and acidity create acidic conditions that support metal dissolution at the anodes of a corrosion system and the necessary cathodic reactions, thus strongly influencing the corrosion behaviour [3]. Mainstream methods used mainly included conventional inhibitors (chromates and organic amines), but their toxicity and regulatory restrictions have shifted the focus to looking for more environmentally friendly alternatives [4]. The use of nanostructured materials has been widely introduced in the literature as possible methods for preventing corrosion [5]. The corrosion resistance of copper (Cu), nickel (Ni) and chromium (Cr) coated materials have been reported as improved in some experimental media with inhibition efficiency up to 98.5% in aggressive media [6]. They have shown potential to have a beneficial effect on the surface stability and corrosion resistance under certain experimental conditions, but the environmental sustainability of these materials depends on the composition, synthesis route, toxicity, service-life behaviour and end-of-life management.
Despite these developments, evaluation methods still face limitations. Conventional laboratory techniques, such as the weight-loss method and potentiodynamic polarisation, can provide valuable information on corrosion behaviour but are time-consuming and cannot fully simulate the heterogeneous environmental, mechanical, and service conditions found in industry over long service periods [7]. This can hinder the efficiency, scalability and repeatability of traditional corrosion-performance testing. Furthermore, numerous studies have investigated the influence of single experimental parameters but have not properly accounted for the combined effects of exposure duration, coating chemistry, and environmental variation, leading to a more partial understanding of corrosion behaviour [8]. One remaining methodological issue is the lack of openly reproducible, data-driven frameworks that combine statistical inference, machine-learning comparison, and explainability for corrosion datasets. It is therefore not a discovery of new corrosion mechanisms, but rather a framework for analytical and reproducibility purposes, which is the contribution of the present study.
While some researchers have used ML to predict corrosion in alloys before Galvão et al. [9], few have used other publicly available databases, such as Kaggle Corrosion Rate, to compare coating performance under similar conditions. In addition, electrochemical impedance spectroscopy (EIS) remains the most common method to assess corrosion; explainable artificial intelligence techniques like SHAP have been studied little to interpret data-driven corrosion models. To fill this methodological void, this paper presents a reproducible pipeline implemented in Python that combines statistical analysis (ANOVA and Tukey HSD), predictive models of machine learning (Random Forest and XGBoost), and techniques from the field of explainable artificial intelligence (XAI) to illustrate a clear framework for processing corrosion-related data [10]. Beyond predictive assessment, the new research paradigm should consider multifunctional smart nanostructured coatings that combine passive barrier protection, stimulus-responsive inhibitor release, and real-time corrosion sensing in a single architecture. A nanostructured matrix in this system may block the flow of water, oxygen, and aggressive ions, while functionalised nanoparticles or nanocontainers may store corrosion inhibitors to release if the coating is damaged or if local pH and/or ionic conditions change. Corrosion-responsive sensing components can sense early electrochemical and/or chemical changes that indicate substrate degradation. Integrating these sensing outputs with IoT-enabled monitoring and machine-learning models could facilitate condition-based maintenance and predictive corrosion management. Therefore, future development of such multifunctional systems should optimize barrier properties, inhibitor release rate, sensing accuracy, coating adhesion, environmental safety, manufacturability, and barrier durability simultaneously.
This research introduces and validates an interpretable and reproducible computational process to statistically infer, predict, and explain small corrosion datasets using an artificial intelligence approach. Only quantities directly supported by the measured source, cumulative bare/coated mass loss and protection efficiency vs exposure time, are used for the measured source. Since no density of specimens nor area of exposed specimens are provided, the corrosion rate is not measured and reported directly in mm/year; no identification of the coated specimen as Cu, Ni, or Cr is provided, so no claim for experimental validation of coating in relation to copper, nickel, or chromium. The synthetic data set is not intended to predict the corrosion performance of Bare, Cu, Ni, or Cr, but is presented as a controlled computational environment to demonstrate the workflow implementation across coating categories. RQ1 analyses the statistical difference between the pre-defined synthetic coating groups; RQ2 compares the predictive models by performing cross validation and tuned held out tests; RQ3 examines the relative contribution of the coating category and exposure days for the predictive model by using one-hot-compatible feature importance and aggregated SHAP analysis; and RQ4 explores how the workflow can be extended to experimentally proven corrosion datasets.
This research is not concerned with materials’ performance; it is a methodological contribution. The study first presents a reproducible analytical workflow that integrates statistical inference, machine-learning comparison, uncertainty estimation, and explainable artificial intelligence for small corrosion datasets. Second, the study is a strong example of how synthetic datasets can be transparently built and analysed, even when little publicly available corrosion data exists. Third, the workflow highlights the need for the right encoding approach, validation methods, and explainability when processing heterogeneous corrosion datasets. Last but not least, the study outlines needs for future application by applying validated experimental corrosion data. The results show that a priori synthetic data yield a lower corrosion rate for Cr and Ni than for bare steel, and that the simulated mean corrosion rate for Cr is the lowest among the coating categories analysed.
The paper is organized in such a way that in Section 2, there is a review of literature on the topic of inhibitors and ML applications, Section 3 explains the methodology, including data preprocessing, EDA, statistics, and ML workflows, Section 4 presents the results of the statistical tests, models performances, and visualizations, Section 5 provides interpretations, alignments to mechanistic understanding, and limitations, in Section 6, the paper outlines challenges and future directions, and provides implications of scalable frameworks.
2. LITERATURE REVIEW
2.1. Conventional Corrosion Inhibitors
Traditional corrosion inhibitors have been the most important means of protecting metals from corrosion, and they include organic, inorganic, and mixed chemical compositions and modes of action [11]. Organic inhibitors may be amines, carboxylates, or heterocyclic molecules containing N, O, and/or S atoms and act predominantly by forming protective films on the metal surface, which retard both anodic and cathodic reactions [12]. Under specific acidic conditions, these inhibitors can undergo physical or chemical adsorption on metallic surfaces, with their adsorption behaviour often following a model (such as the Langmuir or Temkin isotherm). Some conventional organic inhibitors may have issues with biodegradability, persistence, and potential toxicity; however, these can restrict their large-scale use.
Anodic corrosion inhibitors such as chromates, nitrites, and phosphates can form or stabilize surface films that protect against corrosion [13]. Chromate-based inhibitors have historically offered good corrosion protection but are now increasingly limited by regulations such as REACH because of the toxic and carcinogenic nature of hexavalent chromium compounds [14]. The mixed inhibitors are composed of both organic and inorganic components that act synergistically on both half-cell reactions to improve performance in a medium of neutral or alkaline pH [15]. Although these conventional inhibitor systems work well, they often require relatively high concentrations, can persist in the environment, and can perform inconsistently under varying pH, temperature, and exposure conditions, prompting the need to investigate alternative systems using nanostructures.
2.2. Nanostructured Inhibitors and Coatings
In recent years, the emergence of new nanostructured materials has increased the possibilities for corrosion protection by offering a high specific surface area and tuneable interfacial properties, which can be used for barrier reinforcement, surface modification, and active delivery of corrosion inhibitors [16]. Nanostructured materials do not have to replace the currently used organic or inorganic inhibitors but can be used in combination in synergic protection systems. Functionalised nanoparticles and nanocontainers could also serve as reservoirs or transporters for organic inhibitor molecules, releasing the inhibitor molecules in a controlled or stimulus responsive manner upon changes in pH, ionic concentration and/or integrity of the coating induced by local corrosion. The inorganic inhibitors can also cause substrate passivation and the nanostructured fillers can also lower coating permeability and limit transport of corrosive species. This hybrid protection can then be a passive barrier protection plus active corrosion suppression once local coating damage occurs. However, to achieve true synergy, optimization of the concentration of nanoparticles, loading of inhibitors, release kinetics, chemical compatibility, coating adhesion, mechanical properties, environmental safety, and manufacturing reproducibility are required [17]. Some materials, like zinc oxide (ZnO), titanium dioxide (TiO₂), and composites based on graphene, have been found to possess desirable barrier properties and, if designed properly, some nanostructured systems may also exhibit barrier properties that are active and/or self-healing. The efficiencies of corrosion inhibition of the green-synthesised ZnO nanoparticles have been reported up to 98.5% under certain experimental conditions by forming tight protective films that limit chloride ion transport. Likewise, the TiO2 nanotubes can photocatalytically decompose corrosive substances and, when applied to the surfaces of steel, form passive oxide films.
Multi-functional coating materials, such as graphene and derivatives of graphene, graphene oxide (GO) and reduced graphene oxide (rGO), have been investigated owing to the fact that their two-dimensional structures can create tortuous diffusion pathways, which will limit the diffusion of gaseous and ionic corrosive species [18]. Metallic nanostructured coating such as Cr and Ni alloy can be deposited by electrodeposition or physical vapour deposition, and exhibit a pitting potential of 300-500 mV higher than the saturated calomel electrode. As an example, Ni-Cr nanocomposites on 316L stainless steel can increase the corrosion resistance of 3.5% NaCl, as evidenced by electrochemical impedance spectroscopy (EIS) which indicated that |Z| > 106 -1 0 cm2 at low frequency. While nanostructured coatings might decrease the need for some of the conventional and hazardous inhibitors, their sustainability cannot be taken for granted, as the production of nanoparticles, work-site exposure, release to the environment, persistence, leaching out of metal ions, and disposal at the end of their life could create new environmental and toxicological challenges. The small size and high surface reactivity of metallic and metal-oxide nanomaterials are important for the biological interactions, environmental mobility and ecotoxicity [19]. Nanomaterial strategies based on green and bio-inspired approaches can help lower some of the environmental impacts by using plant-based reducing agents and stabilisers, biodegradable polymers, natural inhibitor molecules and synthesis methods that avoid hazardous chemicals. These methods can not only diminish the use of harmful chemicals, but can also maintain the surface activity and barrier properties critical for corrosion protection. However, the use of a nanostructured inhibitor as ‘green’ should not be based only on the efficiency of corrosion-inhibition, but also on the results of the toxicity, leaching, biodegradation, life-cycle and end-of-life assessments [20]. Comparative characteristics of carbon-based, metal-oxide and ferrite nanostructures.
2.3. Comparative Characteristics of Carbon-Based, Metal-Oxide, and Ferrite Nanostructures
Carbon based nanostructures, such as graphene, carbon nanotubes (CNTs), and carbon dots have large specific surface areas, tuneable surface chemistry and the potential to produce tortuous diffusion pathways that prevent the penetration of water, oxygen and aggressive ions through protective coatings [21, 22]. The reinforcement of barrier layers with graphene-based materials is of special interest while functionalised CNTs could help with mechanical reinforcement as well as active incorporation of inhibitor species that form part of the material [23]. But agglomeration, bad dispersion, incompatibility at the interface and complexity of processing can be problematic with carbon-based nanostructures, and in using conductive carbon materials, proper design of the interface with the metallic substrate can be a challenge. Their persistence in the environment and potential exposure to the workplace must also be taken into account [24, 25].
The metal-oxide nanoparticles (ZnO, TiO₂) have various advantages: chemical stability, easy synthesis, high interfacial activity, and the ability to form additional functional properties and passive film [26]. An important feature of nanoscale ferrite material is its intrinsic magnetic responsiveness that is very appealing for architectures of multifunctional coatings where corrosion protection is achieved in combination with magnetic properties [12, 27]. On the other hand, metal-oxide and ferrite nanoparticles can also cluster, release ions, leach and have particle-size dependent particle performance with often strong dependency on coatings matrix compatibility as well as on surface functionalisation. Thus, the choice of materials between carbon and metal-oxide/ferrite nanostructures should depend on the metallic substrate, corrosive conditions, coating chemistry, desired functionality, environmental impact, scalability and cost, and should not be based on the assumption that one class of nanomaterials is superior to the other.
2.4. Data-Driven and Machine Learning Approaches in Corrosion Prediction
To predict the corrosion rate of steels and alloys, based on the combination of environmental, microstructural and electrochemical parameters, data-driven techniques, particularly Machine Learning (ML) have been developed, with better prediction accuracy. Random Forest (RF) and gradient boosting models like XGBoost have also performed well with R2 close to 100% for predicting atmospheric corrosion as they can model the nonlinear relationships [28, 29]. In dynamic environments, such as concrete-embedded rebar, the support vector regression and neural networks have been used to determine the features that most affect the prediction of the alloy corrosion, such as chloride content and pH. Recent studies with 3D-printed micro-lattices demonstrate the possibility of using ML to correlate surface morphology and corrosion, and the XGBoost has been able to determine the important hyperparameters that enhance the overall generalisation [30]. Explainable AI, like SHAP, provides explanations of features of predictive performance, like the nonlinear impact of exposure time, in line with Tafel kinetics. However, many applications have proprietary data sets, limiting the reproducibility [31].
2.5. Research Gaps
There is still a methodological void in open-source corrosion research for the integration of the use of statistical inference, machine-learning prediction, and explainable artificial intelligence (XAI) in a reproducible analytical framework. The studies conducted so far are mostly experimental electrochemical or laboratory data; there has been relatively little work that uses publicly available datasets that can be used to demonstrate the statistical or machine-learning workflows in a reproducible manner. Few reproducible studies combine hypothesis testing, predictive model comparison, and explainability into a cohesive corrosion-analysis workflow, especially in the context of interpreting categories of nominal materials or coatings, without artificially imposing an ordinal ordering. There are thus opportunities to put into place reproducible Python-based frameworks that encompass statistical analysis, machine learning, and explainability with a dedicated examination of differences between synthetic and empirical corrosion datasets and to extend the work to multivariate industrial datasets. Solving this methodological limitation would help to enable more transparent and reproducible evaluation of the corrosion related datasets, and could serve as a template that could then be tested with experimental data.
3. METHODOLOGY
3.1. Dataset Description
The source dataset includes 13 measured exposure-time observations (0, 5, 10, …, 60 days) for a bare steel specimen and one generically coated specimen. Based on these measurements, the study calculated cumulative mass loss (g), cumulative mass loss (%), and protection efficiency (%). The source did not provide the specimens’ density or exposure area, so the standard conversion (weight loss to corrosion rate) cannot be done without unsupported assumptions. It is also not specific to Cu, Ni, or Cr, and therefore can’t be validated using metadata of the measured Cu/Ni/Cr generic coated specimen. A synthetic n = 100 dataset was generated separately with NumPy (random_state = 42) for methodological demonstration. Synthetic corrosion-rate values were generated from predefined normal distributions: Bare N (0.50, 0.05), Cu N (0.18, 0.03), Ni N (0.13, 0.02), and Cr N (0.10, 0.02) mm/year, while exposure days were sampled from {0, 5, 10, 15, 20, 30, 45, 60}. To ensure separation of coating categories with a generally kept within-group variability, the mean and standard deviation of the corrosion rates used for the synthesis were chosen as pre-defined simulation parameters. Both selected means and standard deviations were chosen to be hypothetical differences between the unprotected and protected condition; the standard deviations were chosen to avoid perfectly deterministic difference between the groups. These values are not determined by experimental Cu, Ni or Cr coating studies, and are used as a computation guess for the coating properties for workflow evaluation. They are simulation assumptions and not measurements of the coating performance. Inferential statistics, machine learning accuracy, feature importance and SHAP values for the synthetic dataset then measure relationships in this synthetic analytical dataset and are not estimates of the effectiveness of the coatings in the real world. The methodological process is shown in Fig. (1).
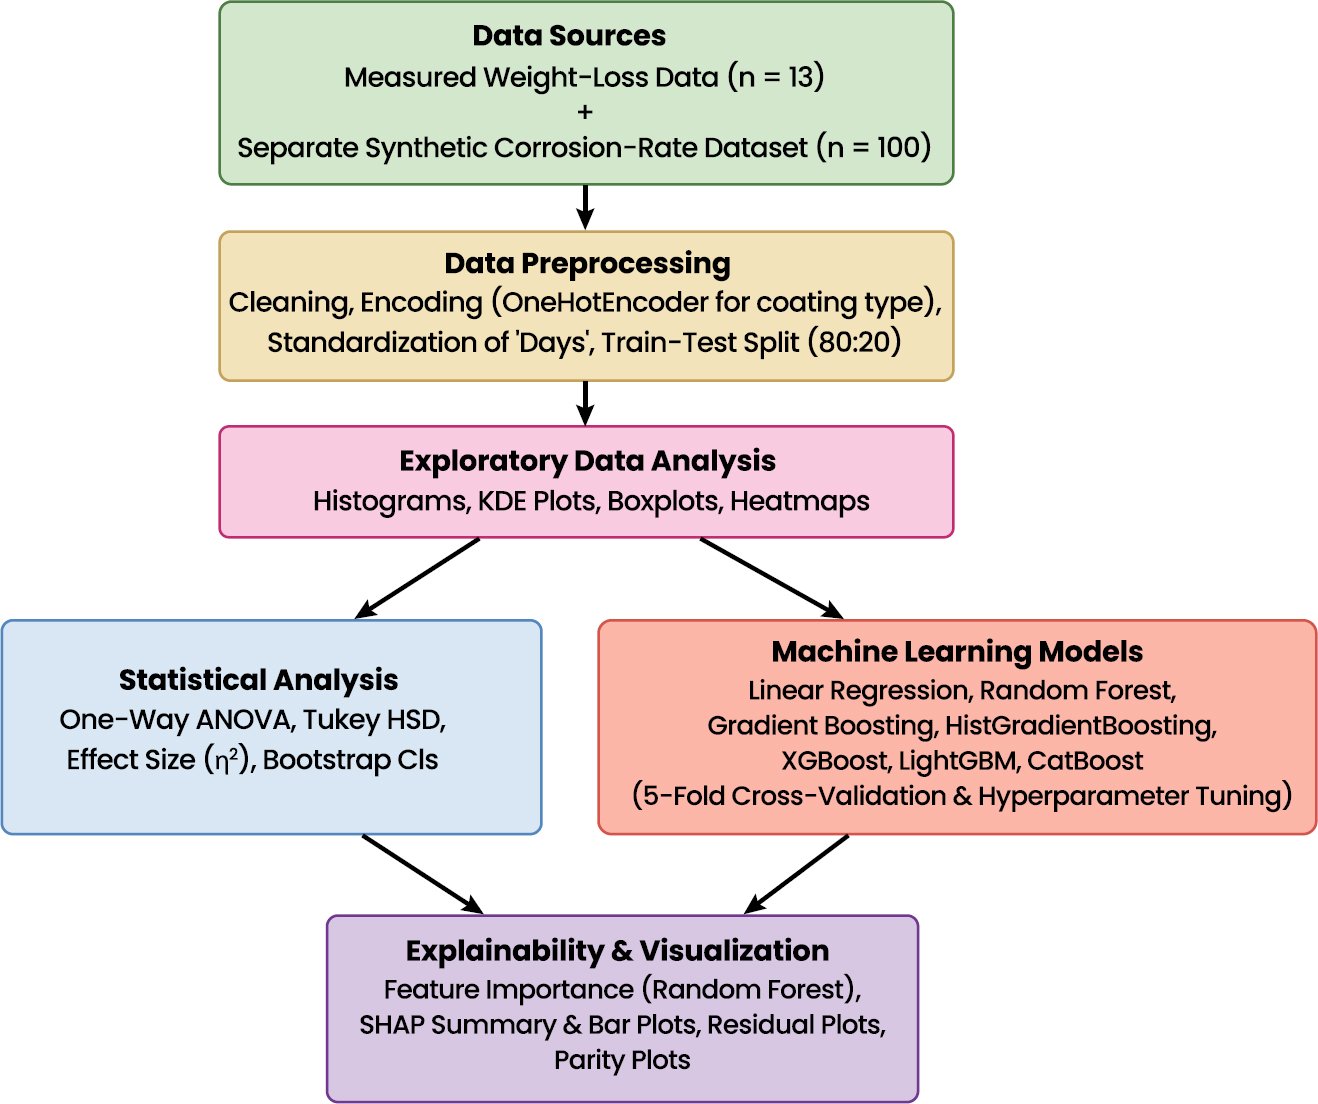
Fig. (1). Proposed methodology.
3.2. Data Preprocessing
Data was handled using pandas and NumPy, models were preprocessed using scikit-learn and processed using XGBoost, LightGBM and CatBoost, analysed inferentially using statsmodels, explained using SHAP and visualised using Matplotlib for visualising the data. The numeric source fields were safely coerced, incomplete rows were discarded, and variables representing measured weight losses were calculated without converting them to mm/year because there was no metadata for density or exposed area.
Instead of LabelEncoder, OneHotEncoder was used for encoding the coating type for the synthetic machine-learning analysis. This resulted in independent binary indicators (Coating_Bare, Coating_Cr, Coating_Cu, and Coating_Ni) and eliminated any artificial ordering between nominal classes of coating materials. To ensure the modelling pipeline was consistent, the exposure days were scaled using the StandardScaler, scaling parameters estimated from the folds of cross validation but the one-hot indicators were not scaled. The five-fold shuffled KFold cross-validation with random_state = 42 was performed for model evaluation. Two separate train/test splits (80:20) with random_state = 42 were performed for hyperparameter optimisation and for held-out evaluation.
3.3. Exploratory Data Analysis (EDA)
The analysis of the measured and synthetic components was performed separately. The trajectories of cumulative mass loss and protection efficiency as a function of exposure time for the measured source were investigated. The uniform corrosion rate distribution was summarized by a synthetic one for the coating. Since the last modelling pipeline relies on one-hot encoding, there is no interpretation of the ordinal relationship between the coating label and the coating. Weaker contributions of exposure time in the synthetic models is not in any way a sign of physical irrelevance of exposure time but rather the result of the statistical design used to generate the data. The measured source shows that the cumulative mass loss is strongly dependent on time, indicating time dependence in the empirical weight-loss trajectory.
3.3.1. Comparison Between Empirical and Synthetic Data Distributions
Comparisons between the distribution of the available measured corrosion-related observations and the distributional synthetic corrosion-rate data set were used to examine transparency of the synthetic data construction. The measured dataset was evaluated by the available weight loss derived variables while the synthetic distributions were evaluated based on the coating categories. These comparisons were made to illustrate the properties of the data generated and were not meant to provide a test of equivalence between the measured and synthetic corrosion behaviour. The weight loss derived variables are shown on a distributional basis together with the synthetic corrosion-rate data in Fig. (2). The variability patterns of the measured bare and coated specimens are different, while the synthetic data shows controlled distribution ranges based on assumptions made in its creation. It is a comparison of the characteristics of the datasets and does not imply direct validation of the rates of corrosion. Fig. (3) presents the distribution of synthetic corrosion-rate values across predefined coating categories. The Bare category shows the highest simulated corrosion-rate range, while coated categories exhibit lower values. The separation reflects the predefined synthetic distributions used for workflow evaluation and does not represent experimentally validated coating performance.
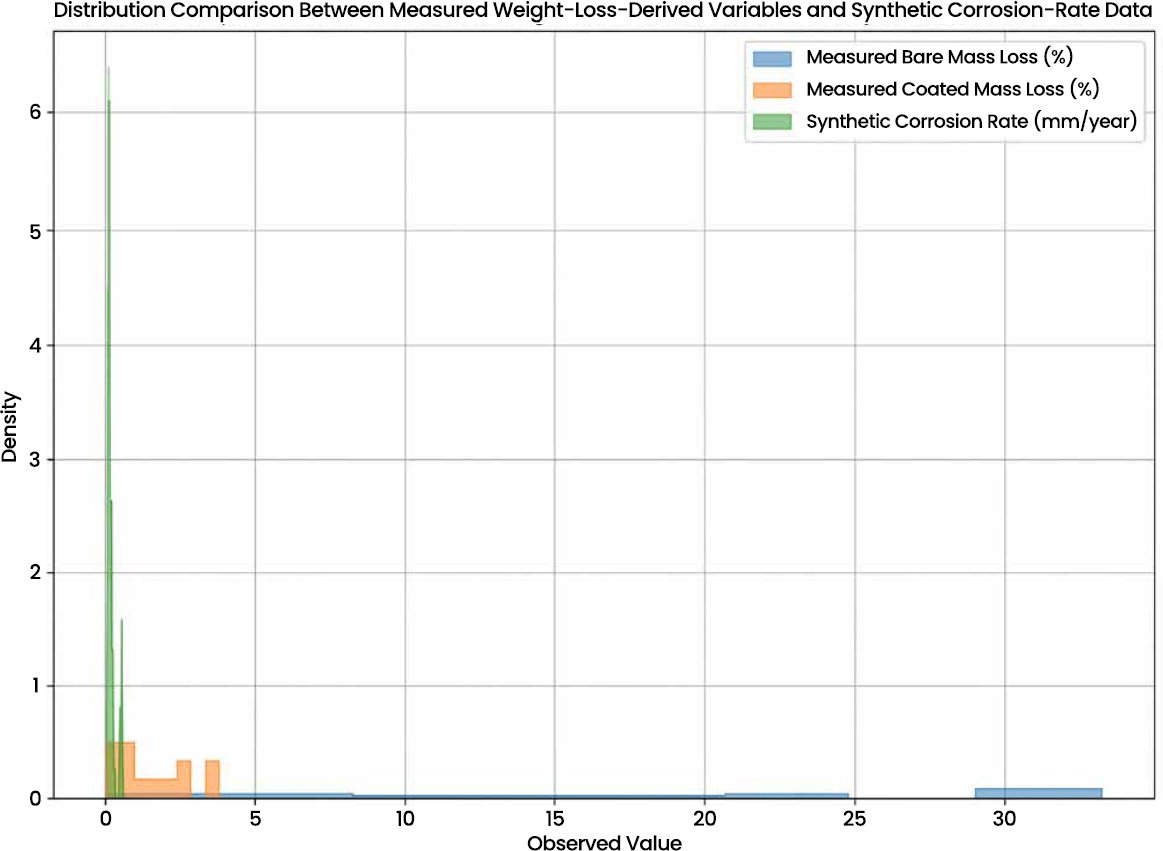
Fig. (2). Distribution comparison between measured weight-loss-derived variables and synthetic corrosion-rate data.
Note: Because the measured source does not contain sufficient information to calculate corrosion rate in mm/year, a like-for-like corrosion-rate distribution comparison was not possible. Therefore, Fig. (2) compares the available empirical weight-loss-derived variables with the synthetic corrosion-rate distributions descriptively rather than statistically. The comparison is intended to demonstrate differences in data structure and variability, not equivalence of the two datasets.
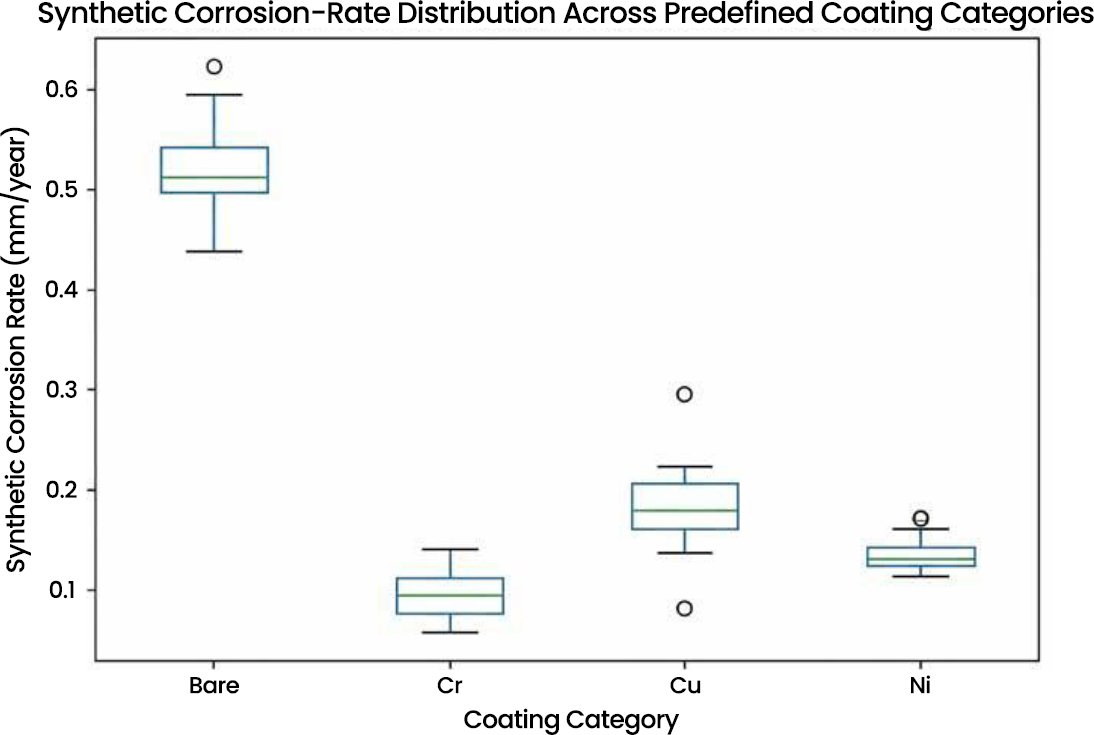
Fig. (3). Boxplot comparison of synthetic corrosion-rate distributions across predefined coating categories.
3.4. Statistical Analysis
The differences in the mean corrosion rates between the four coating categories were assessed with one-way ANOVA in the ordinary least-squares framework (statsmodels):

The group factor τ_i was the coating category (Bare, Cr, Cu, Ni) and Type II Sums of Squares were calculated in the ANOVA model to measure the between group variation to the residual variation.
To complement the normal theory-based confidence intervals, the bootstrap resampling with n_boot = 2000 and random_state = 42 was also used to estimate the 95% percentile based confidence intervals for each synthetic mean of the coating-group means allowing an empirical assessment of uncertainty around the estimated group means without relying solely on the normal theory-based confidence intervals.

Residual diagnostics were used to check the statistical assumptions before performing one-way ANOVA. Normality of residuals was assessed with the Shapiro–Wilk test and by inspecting the Q-Q plots, and homogeneity of variance for the coating groups was tested with Levene’s test. The synthetic corrosion-rate values were produced with a pre-defined normal distribution (though this does not affect the ANOVA assumptions), but residual assessment was performed as well. The independent observations were randomly generated and there were no repeated observations in the synthetic data set. These diagnostic tests confirmed the appropriateness of using one-way ANOVA to test for differences between the pre-established coating categories.
3.5. Machine Learning Models
The evaluated models included Linear Regression as a baseline model, Random Forest Regression, Gradient Boosting Regression, HistGradientBoosting Regression, XGBoost Regression, LightGBM Regression, and CatBoost Regression for a thorough comparison of linear and ensemble learning methods. The coefficient of determination (R²), root mean squared error (RMSE), and the mean absolute error (MAE) were used to assess the predictive performance. The mean and variability of the performance were computed by five-fold shuffled cross-validation with random_state = 42.
Three-fold GridSearchCV with R² as the optimisation criterion was used to perform hyperparameter optimisation on the 80% training partition. Random Forest, Gradient Boosting, XGBoost and LightGBM were tuned on pre-defined parameter grids, and the search for LightGBM was specifically done with the min_child_samples parameter to be able to handle the small synthetic sample. In addition to being tested with a single fixed configuration, CatBoost was also hyperparameter optimised. The best set-up for each model was investigated only based on the training data, and the chosen estimator was tested just once on the remaining 20% of the data that was not used to find the best set-up. This separation allowed the held-out observations to not influence model selection in a direct way, and to yield an independent assessment of predictive performance in the in-silico synthetic data set.
3.5.1. Model Evaluation Metrics
Three regression parameters: coefficient of determination (R²), root mean square error (RMSE), and mean absolute error (MAE) were used to determine the model performance. These metrics were chosen to complement the measure of explained variance in evaluating predictive accuracy, including the overall magnitude of the prediction error and the average absolute error of the prediction.
The coefficient of determination (R²) is the proportion of the variance in observed values of the corrosion rate explained by the model and is obtained as follows:

Where yᵢ is the observed value, ŷᵢ is the predicted value, and ȳ is the mean of the observed value. Root mean squared error (RMSE) is the square root of the mean of the squared differences between the observed and predicted values and is used as:

where n is the number of all observations. This is known as mean absolute error (MAE) and is defined as:

3.6. Explainability and Visualisation
The feature space was one-hot encoded and the explainability was aligned. The features and coating indicators were reported separately to obtain the random forest feature importance. The tuned XGBoost model was used for the calculation of the SHAP values with SHAP TreeExplainer and the mean absolute values from the corresponding one-hot columns of the coatings were combined to one group ‘Coating category’ for comparison to the group ‘Exposure days’. This allows for nominal-category interpretation without having to calculate the coating type as an artificial continuous scale.

The final implementation reports model-performance tables, feature importance using a random forest (one-hot), the XGBoost SHAP summary, and aggregated SHAP importance.
4. RESULTS
Within the dataset, mean corrosion rates remained 0.51991 mm/year for Bare, 0.09606 for Cr, 0.18138 for Cu, and 0.13561 for Ni. ANOVA remained significant (F = 744.7167, p = 2.524017 × 10⁻⁶⁶) with η² = 0.9588, and Tukey HSD retained significant pairwise separation. Measured source gave 88.89% protection efficiency on Day-60. The mean synthetic relative protection was 73.52%, with a descriptive measured-minus-synthetic gap of 15.37 percentage points – this is a dimensionless comparison and not a direct validation of corrosion rates. The final one-hot encoded model comparison shows that Linear Regression has the highest mean 5-fold cross validation performance with CV R² value of 0.9517, CV RMSE value of 0.0334 and CV MAE value of 0.0262 followed by CatBoost with a CV R² value of 0.9402, CV RMSE value of 0.0339 and CV MAE value of 0.0296, LightGBM with a CV R² value of 0.9333, CV RMSE value of 0.0343, CV MAE value of 0.0297, Random Forest with a CV R² value of 0.9300, CV RMSE value of 0.0345 and CV MAE value of 0.0299, Gradient Boosting with a CV R² value of 0.9277, CV RMSE value of 0.0349 and CV MAE value of 0.0301, XGBoost with a CV R² value of 0.9261, CV. After the parameters were optimized, XGBoost obtained the best held-out test result (R² = 0.9175, RMSE = 0.0384, MAE = 0.0253), which was slightly better than Gradient Boosting (R² = 0.9174) and CatBoost (R² = 0.9158), but the difference was statistically insignificant.
Fig. (4) depicts the measured cumulative mass-loss trajectories directly given by the specimen weights uploaded. By Day 60, the bare-steel mass loss had reached 33.11%, while the coated specimen (generic coating) had only lost 3.75% of its mass. These measured trajectories provide some protection for the unknown coated specimen, but do not specify Cu-, Ni-, or Cr-specific performance. The final implementation also eliminates the previous interpretation of the ordinal Coating_Label correlation as it is a nominal attribute.
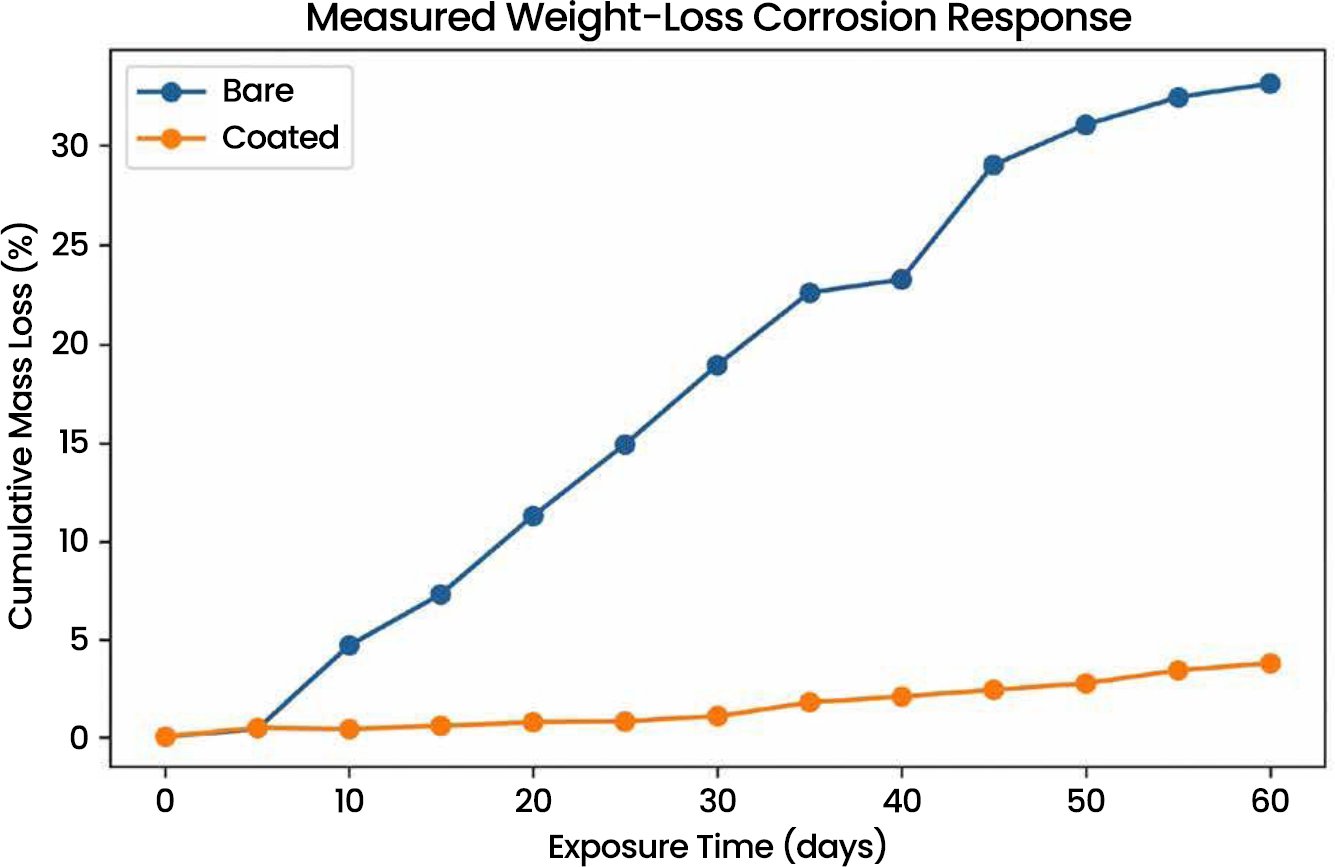
Fig. (4). Measured cumulative mass-loss response for bare and generic coated specimens.
As shown in Table 1, one-way ANOVA identified statistically significant differences in mean corrosion rate among the predefined synthetic coating groups (F = 744.72, p = 2.52 × 10⁻⁶⁶). The large between-group sum of squares relative to the residual sum of squares reflects the strong separation intentionally embedded in the synthetic coating-specific distributions. These results indicate substantial between-group separation within the predefined synthetic distributions and should not be interpreted as evidence of a physical corrosion mechanism.
Table 1. ANOVA results showing the effect of coating type on corrosion rate.
| Source | Sum of Squares | df | F-value | p-value |
| C(Coating) | 2.4638 | 3 | 744.72 | 2.52 × 10-66 |
| Residual | 0.1059 | 96 | – | – |
Table 2 shows that the Tukey HSD post-hoc test identified statistically significant differences between all coating pairs (p < 0.001). The highest corrosion rate was observed in bare steel, which showed substantially higher corrosion compared with chromium (0.424 mm/yr reduction), copper (0.339 mm/yr reduction), and nickel (0.384 mm/yr reduction). Nickel exhibited a lower simulated corrosion rate than copper, while chromium had the lowest simulated corrosion rate among the coating categories; however, this hierarchy reflects the predefined synthetic distributions and does not constitute experimental evidence that chromium provides superior corrosion protection. Each confidence interval excludes zero, demonstrating statistically significant differences among the coating groups within the synthetic dataset. The simulated corrosion-rate hierarchy was observed as Bare > Cu > Ni > Cr, indicating that bare steel exhibited the highest simulated corrosion rate while chromium coating demonstrated the lowest simulated corrosion rate among the evaluated categories.
Table 2. Tukey HSD post-hoc results for pairwise comparisons of mean corrosion rates.
| Group 1 | Group 2 | meandiff | p-adj | Lower | Upper | Significant |
| Bare | Cr | -0.424 | <0.001 | -0.449 | -0.399 | Significant |
| Bare | Cu | -0.339 | <0.001 | -0.364 | -0.313 | Significant |
| Bare | Ni | -0.384 | <0.001 | -0.411 | -0.358 | Significant |
| Cr | Cu | 0.085 | <0.001 | 0.062 | 0.109 | Significant |
| Cr | Ni | 0.040 | <0.001 | 0.016 | 0.063 | Significant |
| Cu | Ni | -0.046 | <0.001 | -0.070 | -0.021 | Significant |
Table 3 shows that bare steel exhibits the highest simulated mean corrosion rate (0.5199 mm/year), followed by Cu (0.1814 mm/year), Ni (0.1356 mm/year), and Cr (0.0961 mm/year). Within the predefined synthetic dataset, chromium has the lowest simulated corrosion rate and therefore represents the most protective coating among the evaluated categories. These observations reflect the assigned synthetic distributions and should not be interpreted as experimentally validated corrosion performance.
Table 3. Bootstrap 95% confidence intervals for mean corrosion rates.
| Coating | Mean | Cl_lower | Cl_upper |
| Bare | 0.5199 | 0.5004 | 0.5441 |
| Cr | 0.0961 | 0.0881 | 0.1045 |
| Cu | 0.1814 | 0.1670 | 0.1966 |
| Ni | 0.1356 | 0.1293 | 0.1428 |
Table 4 shows that Linear Regression achieved the highest mean five-fold cross-validation performance in the final one-hot encoded comparison (CV R² = 0.9517, CV RMSE = 0.0334, CV MAE = 0.0262). CatBoost ranked second (CV R² = 0.9402), followed by LightGBM (0.9333), Random Forest (0.9300), Gradient Boosting (0.9277), XGBoost (0.9261), and HistGradientBoosting (0.3809). These results differ from the earlier label-encoded implementation and represent the values generated by the final reproducible analytical workflow.
Table 4. Five-fold cross-validation performance of all models in the final one-hot implementation.
| Model | CV_R2 | CV_R2_SD | CV_RMSE | CV_MAE |
| LinearRegression | 0.951671 | 0.024949 | 0.033372 | 0.026182 |
| CatBoost | 0.940164 | 0.027588 | 0.037366 | 0.028230 |
| LightGBM | 0.933323 | 0.028183 | 0.039199 | 0.029567 |
| RandomForest | 0.929997 | 0.025927 | 0.040556 | 0.030503 |
| GradientBoosting | 0.927687 | 0.028475 | 0.041188 | 0.030855 |
| XGBoost | 0.926094 | 0.026768 | 0.041796 | 0.031291 |
| HistGradientBoosting | 0.380924 | 0.303773 | 0.114151 | 0.087882 |
Table 5 reports the tuned held-out test results from the final implementation. XGBoost achieved the highest test R² (0.9175) with RMSE = 0.0384 and MAE = 0.0253. Gradient Boosting was nearly equivalent (R² = 0.9174), followed by CatBoost (0.9158), Random Forest (0.9073), and LightGBM (0.9025). These test results assess reconstruction of the predefined synthetic relationships and do not demonstrate external predictive validity on independent experimental corrosion-rate data.
Table 5. Hyperparameter-optimised held-out test performance in the final implementation.
| Model | Best Internal CV R² | Test R² | Test RMSE | Test MAE |
| XGBoost | 0.953303 | 0.917504 | 0.038414 | 0.025330 |
| GradientBoosting | 0.953047 | 0.917375 | 0.038444 | 0.025673 |
| CatBoost | 0.940396 | 0.915831 | 0.038802 | 0.025964 |
| RandomForest | 0.953540 | 0.907318 | 0.040717 | 0.027709 |
| LightGBM | 0.949416 | 0.902526 | 0.041756 | 0.028802 |
Fig. (5) reports Random Forest importance in the final one hot feature space. Coating_Bare has the largest individual importance (0.955253), followed by Coating_Cr (0.021059), Coating_Cu (0.013177), Days (0.007164), and Coating_Ni (0.003346). These values describe how the fitted synthetic-data model uses the encoded predictors and should not be interpreted as physical percentages of real-world corrosion causation.
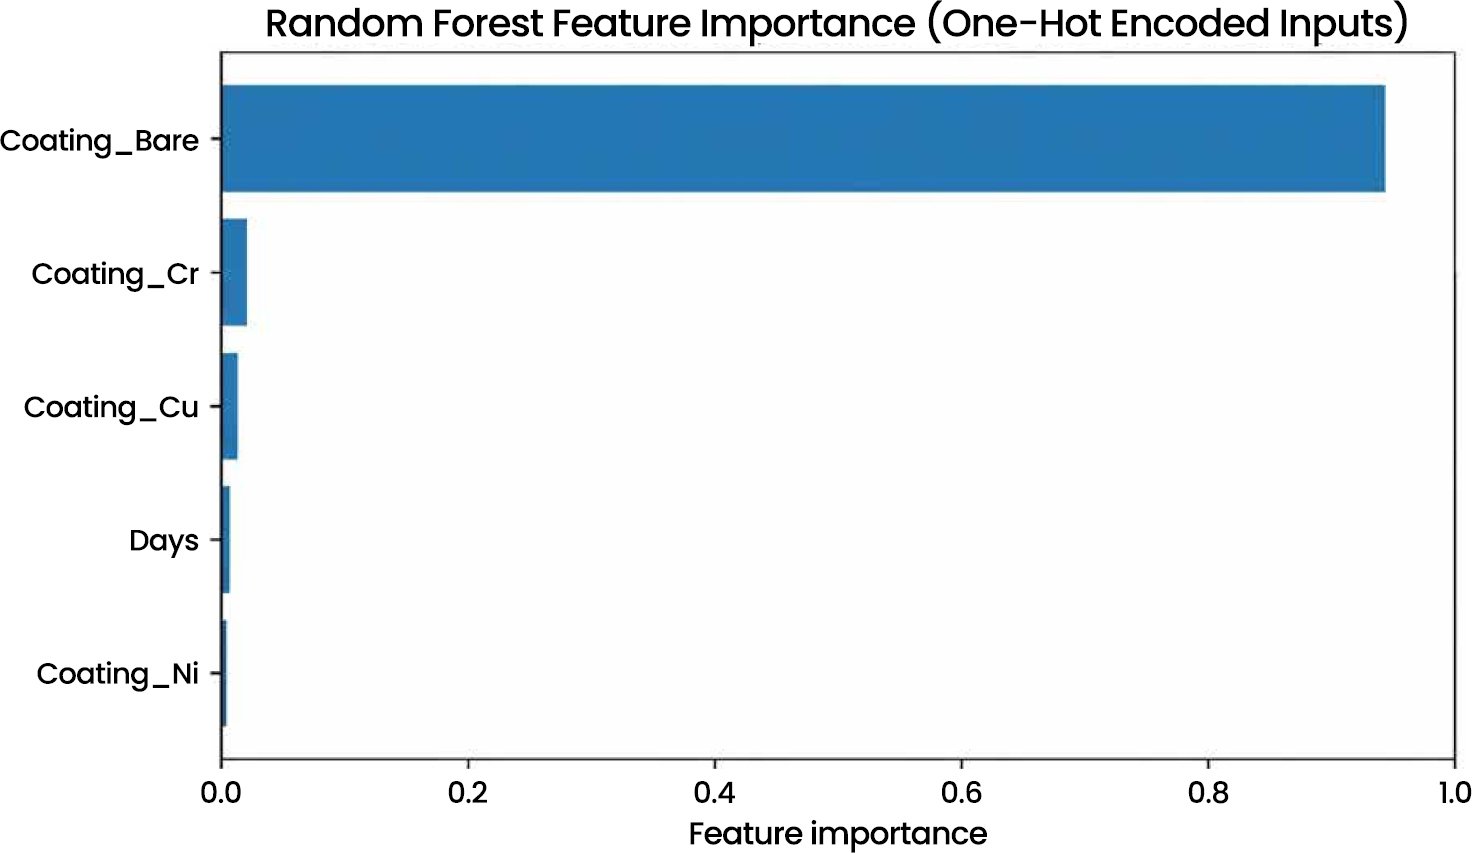
Fig. (5). Random forest feature importance using one-hot encoded coating indicators.
Table 6 confirms that feature importance is now distributed across nominal one-hot coating indicators rather than a single ordinal Coating_Label. Coating_Bare dominates the fitted Random Forest importance (0.955253), while the remaining coating indicators and Days have substantially smaller individual importance. This resolves the artificial ordinal-coding concern while retaining the coating-category signal embedded in the synthetic generation procedure.
Table 6. Random forest feature importance for one-hot encoded synthetic predictors.
| Feature | Importance |
| Coating_Bare | 0.955253 |
| Coating_Cr | 0.021059 |
| Coating_Cu | 0.013177 |
| Days | 0.007164 |
| Coating_Ni | 0.003346 |
Fig. (6) presents the XGBoost SHAP summary using one-hot encoded coating indicators and Days. The plot shows category-specific contributions without imposing a numerical order on Bare, Cr, Cu, and Ni. Positive and negative SHAP values indicate contributions that raise or lower a prediction relative to the model baseline. The largest visible contributions are associated with the coating indicators, especially Coating_Bare, while Days remains comparatively small within the synthetic construction.
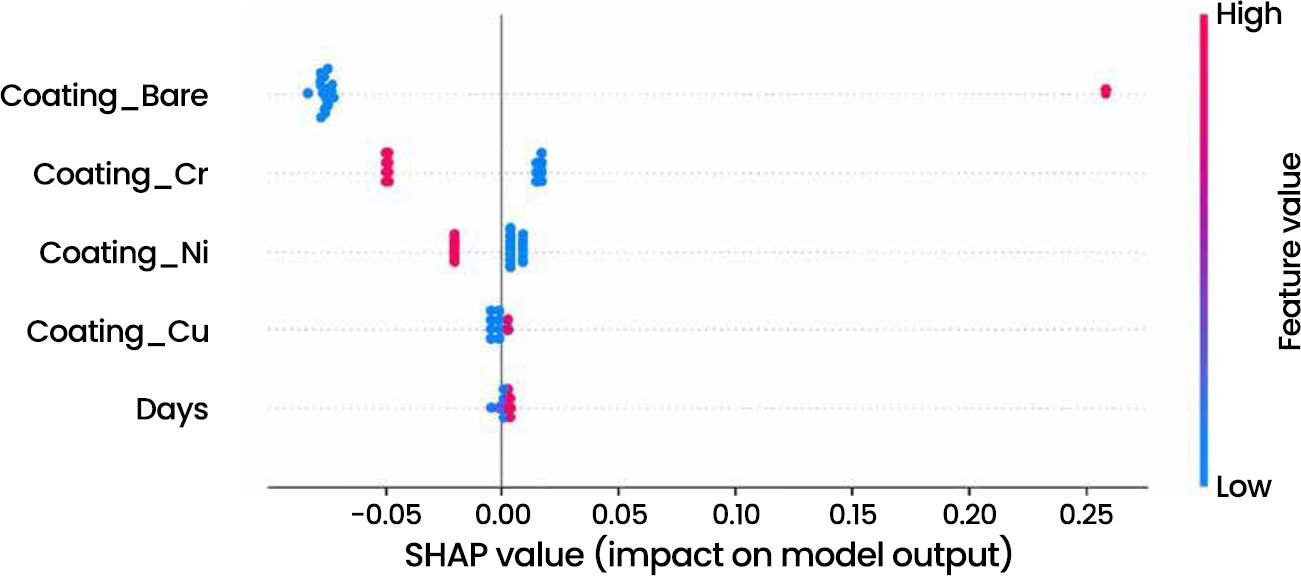
Fig. (6). XGBoost SHAP summary from the final one-hot encoded implementation.
Fig. (7) presents aggregated SHAP importance from the final implementation. Mean absolute SHAP values for Coating_Bare, Coating_Cr, Coating_Cu, and Coating_Ni were combined into a single coating-category contribution. The resulting relative importance was 0.980856 for coating category and 0.019144 for exposure days (mean absolute SHAP = 0.136350 and 0.002661, respectively). Aggregation provides a defensible comparison between the nominal coating factor and exposure time without relying on arbitrary label coding.
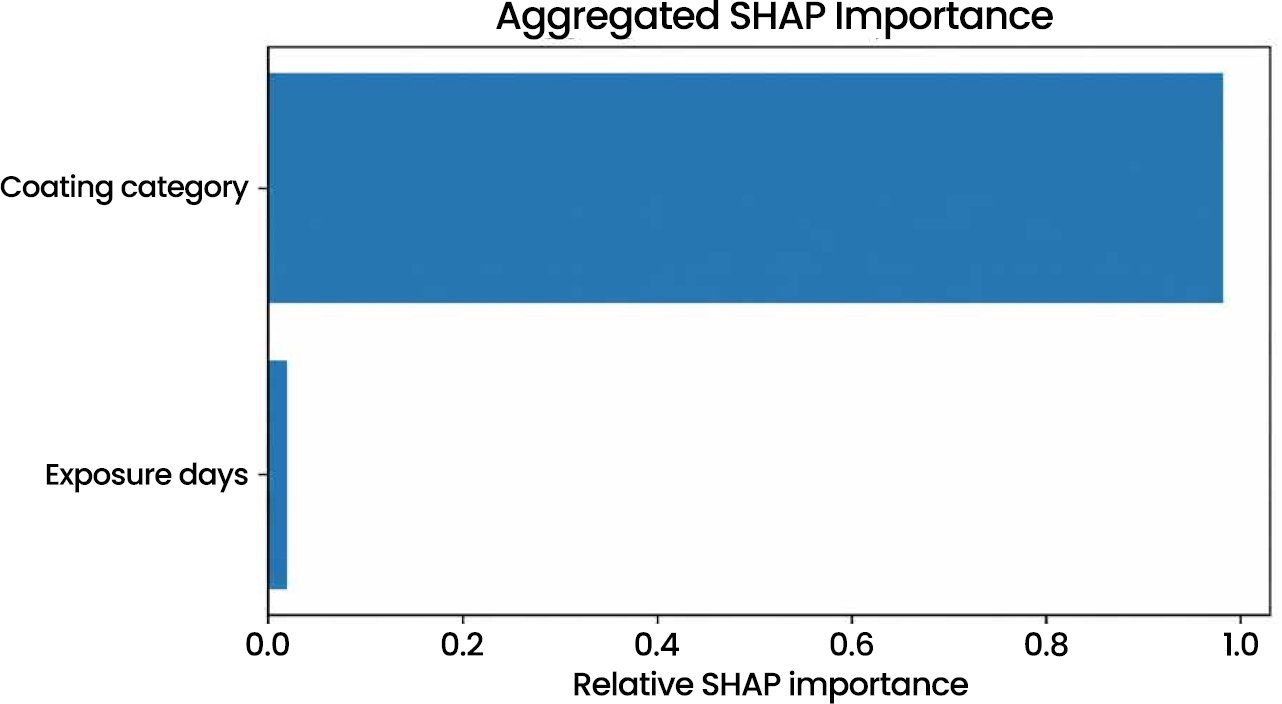
Fig. (7). Aggregated SHAP importance for coating category versus exposure days.
5. DISCUSSION
The final analysis distinguishes between evidence which has been measured and synthetic methodological demonstration. The measured weight-loss source provides a clear exposure-time relationship and a Day-60 protection efficiency of 88.89% for the generic coated specimen, but it does not provide a direct relationship to the corrosion rate (mm/year) since the density of the specimen and the exposed area are not available. Additionally, it doesn’t specify the measured coating as Cu, Ni or Cr. Therefore, there is no experimental validation of the Cu/Ni/Cr specific type of the invention claimed. In the synthetic data set, the separation deliberately included in the a priori distribution of coatings is reflected in ANOVA (F = 744.7167, p = 2.524017 × 10⁻⁶⁶, η² = 0.9588; Tukey HSD). The difference between the measured Day-60 protection (88.89%) and the synthetic mean relative protection (73.52%) is 15.37 percentage points, although this is descriptive, it does not replace matched experimental corrosion-rate validation.
The methodological approach is supported by comparing with previous literature, but the present synthetic results are not directly comparable with the results of the coating experiments. Mohammadzadeh et al. [32] validated the Ni–Cr nanocomposite coatings under laboratory settings with the help of electrochemical impedance spectroscopy (EIS). The present study does not focus on the physical corrosion behaviour, but shows a synthetic approach to establish a computational workflow. Thus, the two studies cannot be directly compared, but should be seen as tackling distinct aims. Another recent work] was conducted by Ghorbani et al. [24] that developed supervised machine-learning algorithms to assess the corrosion based on experimentally derived and generative datasets, whereas the present work is based on a reproducible computational workflow based on synthetically generated corrosion data. The literature cited is therefore only used as a background of the context and should not be interpreted as a validation of the results presented here. Previous reviews of nanostructured corrosion inhibitors are helpful to give a scientific context of the corrosion research. This paper does not, however, assess the coating performance in the laboratory nor does it seek to replicate published results from the laboratory. Rather, it illustrates how statistical analysis and explainable AI and machine learning can be incorporated in a clear computational process.
The methodological contribution is the reproducible Python/Google Colab workflow that combines the weight-loss derivation from measurements, statistical inference, one-hot encoded machine learning, comparison of the resulting model to others, small-sample-aware hyperparameter tuning and explainability. The final implementation eliminates artificial ordinal coding of type of coating, includes customization of LightGBM with min_child_samples, customizes CatBoost (does not use a fixed configuration), and aggregates SHAP values over the one-hot columns of coating. Linear Regression performed the best mean cross-validation performance (R² = 0.9517) while tuned XGBoost had the best held-out test performance (R² = 0.9175). This highlights the importance of reporting not just resampling performance, but of also reporting the results of a held-out set of data: the model selected based on one metric may not be the optimal model for the held-out set.
LIMITATIONS AND FUTURE DIRECTION
A further drawback is that the statistical relationships learned by the machine learning models are based on pre-defined synthetic distributions, and not upon the natural experimental variation. Predictive capability is therefore not necessarily representative of material behaviour, but is actually a simulation of patterns. The small sample size of the synthetic dataset (n = 100) adds to the methodological limitations that should be taken into account when interpreting the machine-learning results. They can lead to more significant differences in model predictions, and higher risk of overfitting, especially when the model has a higher level of flexibility and complexity, such as ensemble algorithms. They can cause larger differences in model estimates and greater risk of overfitting, especially with complex models with greater flexibility, such as ensemble algorithms. It is also possible that different differences in model performance could occur depending on the train-test split and cross-validation settings, so the observed differences between algorithms should be treated with caution. Additionally, outputs related to feature importance and explainability can be unstable based on small amounts of observations in the data set, meaning that the contribution to each of the predictors in the model can vary based on the data set and the small changes in the data set. The results presented, therefore, should be viewed as an example of the implementation of the workflow and not as proof of the superiority of the models or as their general ability to predict corrosion systems.
Another challenge is the translation of the laboratory-controlled nanostructured corrosion-protection technologies to industry scale production. While it is easy to produce homogeneous dispersions at small production scales, the dispersion of the nanoparticles becomes more difficult at large production scales due to agglomeration, which can cause decrease in the active surface area, defects in the coating, and non-uniform protective properties in space. However, the cost of the raw materials is not the only factor that has to be taken into account for economic feasibility; the required production methods for the synthesis of the nanoparticles, their purification, surface functionalisation, dispersion, coating deposition, quality control, equipment and maintenance cost have to be considered as well. Evaluation of environmental and occupational safety practices is required since exposures and/or releases to nanoparticles may occur during manufacture, application of coat, abrasion, weathering, maintenance and disposal. Another challenge is the long-term stability as the protective performance could deteriorate over time due to migration of nanoparticles, leaching, aggregation, coating delamination, and changes in the chemistry of the interfaces. Reproducible manufacturing protocols, validation at pilot scale, techno-economic assessment, evaluation of environmental risks and long-term performance testing are all required for successful industrial scale-up [15].
Further research is required to confirm the computational framework with experimental corrosion data collected by other methods like electrochemical impedance spectroscopy, potentiodynamic polarisation and weight loss measurements. Repeated Wet-Dry cycling, accelerated Salt spray and real environment field test should also be added to long-term durability evaluation. Wet–dry cycling is significant because it can change the electrolyte concentration, oxygen transport, coating swelling, drying stresses and depletion of the inhibitors and the salt spray test is used to assess resistance to sustained chloride exposure, but it is an accelerated test. No simulated lab testing can duplicate the combination of humidity, temperature extremes, and various pollutants, UV deterioration, mechanical abrasion and complex contaminants found in the real environment, which is why real-environment testing is essential. The protective performance of a short-term lab experiment may be accurate but it does not necessarily account for progressive phenomena like nanoparticle migration, depletion of inhibitors, leaching, delamination of coatings, interfacial degradation, loss of adhesion, etc. An evaluation of industrial durability should, therefore, be made using a combination of complementary accelerated and long-term field testing, not just short-term laboratory testing. Future studies could also expand the framework to other multifunctional nanocomposite coatings based on graphene and incorporate IoT-based corrosion sensors with machine-learning algorithms to enable real-time monitoring and prediction of corrosion conditions.
CONCLUSION
This study demonstrates a revised, reproducible workflow that distinguishes measured weight-loss evidence from synthetic corrosion-rate modelling. The measured source supports cumulative mass-loss analysis and a Day-60 protection efficiency of 88.89% for a generic coated specimen, but direct measured corrosion rate in mm/year cannot be calculated without specimen density and exposed area, and Cu/Ni/Cr-specific experimental validation cannot be established without coating metadata. In the synthetic dataset (n = 100), ANOVA confirmed strong predefined between-group separation (F = 744.7167, p = 2.524017 × 10⁻⁶⁶, η² = 0.9588). With nominal coating type represented by OneHotEncoder, Linear Regression achieved the highest mean five-fold cross-validation R² (0.9517), while tuned XGBoost achieved the highest held-out test R² (0.9175; RMSE = 0.0384; MAE = 0.0253). However, these performance estimates should be interpreted within the context of the limited synthetic sample size (n = 100), where model ranking, feature importance, and predictive stability may vary when evaluated using larger experimentally validated datasets. Random Forest importance was led by Coating_Bare (0.955253), and aggregated SHAP importance was 0.980856 for coating category versus 0.019144 for exposure days. These values reproduce the final implementation outputs and describe only the constructed analytical dataset. Future validation requires measured specimen area and density, explicit Cu/Ni/Cr coating identities, and matched experimental corrosion-rate observations.
LIST OF ABBREVIATIONS
CNTs | = | Carbon Banotubes |
EDA | = | Exploratory Data Analysis |
EIS | = | Electrochemical Impedance Spectroscopy |
ML | = | Machine Learning |
MAE | = | Mean Absolute Error |
RF | = | Random Forest |
RGO | = | Reduced Graphene Oxide |
RMSE | = | Root Mean Squared Error |
AUTHOR’S CONTRIBUTION
S.S. has contributed to the study conceptualization, methodology, data analysis, interpretation of results, and manuscript writing.
ETHICAL APPROVAL & INFORMED CONSENT
This study did not involve human participants or animal subjects; hence, ethical approval was not required.
AVAILABILITY OF DATA AND MATERIALS
The datasets generated or analysed during this study are available from the corresponding author on reasonable request. The base data are accessible via the public Kaggle repository (“Corrosion Rate Dataset”). The measured source data and the code required to reproduce the synthetic dataset and analytical workflow are also available from the corresponding author on reasonable request. The synthetic corrosion-rate dataset used for machine-learning demonstration was generated computationally from the distributional assumptions reported in Section 3.1 and was not interpreted as independently measured Cu, Ni, or Cr corrosion data.
FUNDING
This research received no specific grant from any funding agency in the public, commercial, or not-for-profit sectors.
CONFLICT OF INTEREST
The author declares that there are no conflicts of interest regarding the publication of this paper.
ACKNOWLEDGEMENTS
The author acknowledges Kaggle for providing the open-source corrosion dataset and express gratitude to the open-source Python community for developing the computational tools (NumPy, scikit-learn, SHAP, and Matplotlib) that enabled this research.
DECLARATION OF AI
During the preparation of this manuscript, the author used ChatGPT for language editing and refinement purposes. Following the use of this tool, the author carefully reviewed and revised the content where necessary and accept full responsibility for the final published version of the article.
REFERENCES
[1] Al-Moubaraki, A. H.; Obot, I. B. Corrosion Challenges in Petroleum Refinery Operations: Sources, Mechanisms, Mitigation, and Future Outlook. J. Saudi Chem. Soc. 2021, 25(12), 101370.
https://doi.org/10.1016/j.jscs.2021.101370
[2] Malini, S.; Anantharaju, K. S. Nanomaterials for Fuel Cell and Corrosion Inhibition: A Comprehensive Review. Curr. Nanosci. 2021, 17(4), 591–611.
http://dx.doi.org/10.2174/1573413716666210101121907
[3] Odeyemi, O. O.; Alaba, P. A. Microbiologically Influenced Corrosion in Oil Fields: Mechanisms, Detection, and Mitigation Strategies. In Corrosion Engineering: Recent Breakthroughs and Innovative Solutions; IntechOpen, 2024.
https://doi.org/10.5772/intechopen.1005181
[4] Ahmed, M. A.; Amin, S.; Mohamed, A. A. Current and Emerging Trends of Inorganic, Organic and Eco-Friendly Corrosion Inhibitors. RSC Adv. 2024, 14(43), 31877–31920.
https://doi.org/10.1039/d4ra05662k
[5] Yadav, L.; Sihmar, A.; Kumar, S.; Dhaiya, H.; Vishwakarma, R. Review of Nano-Based Smart Coatings for Corrosion Mitigation: Mechanisms, Performance, and Future Prospects. Environ. Sci. Pollut. Res. 2025, 32, 17032–17058.
https://doi.org/10.1007/s11356-024-33234-9
[6] Oreko, B. U.; Okuma, S. O. Recent Advances in Nanoparticle-Based Corrosion Inhibition of Metals: A Review. NIPES J. Sci. Technol. Res. 2025, 7(3), 245–265.
https://doi.org/10.37933/nipes/7.3.2025.1449
[7] Ferreira, M. O. A.; Mariani, F. E.; Leite, N. B.; Gelamo, R. V.; Aoki, I. V.; de Siervo, A.; Pinto, H. C.; Moreto, J. A. Niobium and Carbon Nanostructured Coatings for Corrosion Protection of the 316L Stainless Steel. Mater. Chem. Phys. 2024, 312, 128610.
https://doi.org/10.1016/j.matchemphys.2023.128610
[8] Fatehbasharzad, P.; Fatehbasharzad, P.; Sillanpää, M.; Shamsi, Z. Investigation of Bioimpacts of Metallic and Metallic Oxide Nanostructured Materials: Size, Shape, Chemical Composition, and Surface Functionality: A Review. Part. Part. Syst. Charact. 2021, 38(10), 2100112.
https://doi.org/10.1002/ppsc.202100112
[9] Galvão, T. L. P.; Novell-Leruth, G.; Kuznetsova, A.; Tedim, J.; Gomes, J. R. B. Elucidating Structure–Property Relationships in Aluminum Alloy Corrosion Inhibitors by Machine Learning. J. Phys. Chem. C 2020, 124(10), 5624–5635.
https://doi.org/10.1021/acs.jpcc.9b09538
[10] Krishnamoorthy, U.; Balasubramani, S. Intelligent Nanomaterial Image Characterizations: A Comprehensive Review on AI Techniques That Power the Present and Drive the Future of Nanoscience. Adv. Theory Simul. 2024, 7(12), 2400479.
https://doi.org/10.1002/adts.202400479
[11] Al-Amiery, A. A.; Isahak, W. N. R. W.; Al-Azzawi, W. K. Corrosion Inhibitors: Natural and Synthetic Organic Inhibitors. Lubricants. 2023, 11(4), 174.
https://doi.org/10.3390/lubricants11040174
[12] Kuznetsov, Y. I.; Redkina, G. V. Thin Protective Coatings on Metals Formed by Organic Corrosion Inhibitors in Neutral Media. Coatings. 2022, 12(2), 149.
https://doi.org/10.3390/coatings12020149
[13] Al-Amiery, A. A.; Yousif, E.; Isahak, W. N. R. W.; Al-Azzawi, W. K. A Review of Inorganic Corrosion Inhibitors: Types, Mechanisms, and Applications. Tribol. Ind. 2023, 45(2), 313–339.
https://doi.org/10.24874/ti.1456.03.23.06
[14] Vaghefinazari, B.; Wierzbicka, E.; Visser, P.; Posner, R.; Arrabal, R.; Matykina, E.; Mohedano, M.; Blawert, C.; Zheludkevich, M. L.; Lamaka, S. V. Chromate-Free Corrosion Protection Strategies for Magnesium Alloys: A Review: Part III: Corrosion Inhibitors and Combining Them with Other Protection Strategies. Materials. 2022, 15(23), 8489.
https://doi.org/10.3390/ma15238489
[15] Verma, C.; Ebenso, E. E.; Quraishi, M. A.; Hussain, C. M. Recent Developments in Sustainable Corrosion Inhibitors: Design, Performance and Industrial Scale Applications. Mater. Adv. 2021, 2(12), 3806–3850.
https://doi.org/10.1039/d0ma00681e
[16] Swathy, O.; Priya, S. S.; Navada, M. K.; Mulky, L. Advances in Corrosion Inhibition: Nanomaterials as Sustainable Solutions for Protecting Metals. J. Chem. Technol. Biotechnol. 2025, 100(10), 2004–2018.
https://doi.org/10.1002/jctb.7917
[17] Luaibi, H. M.; Al-Tweel, S. S. Hybrid Organic–Inorganic Corrosion Inhibitors: Bridging Performance and Eco-Safety. AUIQ Tech. Eng. Sci. 2025, 2(2), 9.
https://doi.org/10.70645/3078-3437.1038
[18] Assad, H.; Lone, I. A.; Sihmar, A.; Kumar, A.; Kumar, A. An Overview of Contemporary Developments and the Application of Graphene-Based Materials in Anticorrosive Coatings. Environ. Sci. Pollut. Res. 2023, 32, 16958–16977.
https://doi.org/10.1007/s11356-023-30658-7
[19] Sun, J.; Tang, H.; Wang, C.; Han, Z.; Li, S. Effects of Alloying Elements and Microstructure on Stainless Steel Corrosion: A Review. Steel Res. Int. 2022, 93(5), 2100450.
https://doi.org/10.1002/srin.202100450
[20] Tidke, S. D.; Kulkarni, S. S.; Marathe, A. C. Comprehensive Review of Green Corrosion Inhibitors for Safe and Sustainable Protection of Mild Steel in Acidic Environments. Discov. Electrochem. 2025, 2, 40.
https://doi.org/10.1007/s44373-025-00055-5
[21] Batra, R.; Song, L.; Ramprasad, R. Emerging Materials Intelligence Ecosystems Propelled by Machine Learning. Nat. Rev. Mater. 2021, 6, 655–678.
https://doi.org/10.1038/s41578-020-00255-y
[22] Chen, Y.; Chen, H.; Harker, A.; Liu, Y.; Huang, J. A Supervised Machine Learning Tool to Predict the Bactericidal Efficiency of Nanostructured Surface. J. Nanobiotechnol. 2024, 22, 748.
https://doi.org/10.1186/s12951-024-02974-8
[23] Sharma, S. K.; Miladinović, S.; Sharma, L. K.; Gajević, S.; Sharma, Y.; Sharma, M.; Čukić, S.; Stojanović, B. Graphene/CNT Nanocomposites: Processing, Properties, and Applications. Nanomaterials. 2026, 16(2), 100.
https://doi.org/10.3390/nano16020100
[24] Ghorbani, M.; Li, Z.; Pasquini, A.; Vasa, R.; Birbilis, N. Supervised Machine Learning for Corrosion Assessment of Multi-Principal Element Alloys Using Experimental and Generative Datasets. npj Mater. Degrad. 2025, 9, 155.
https://doi.org/10.1038/s41529-025-00700-9
[25] Thomas, P.; Sahoo, B. N.; Thomas, P. J.; Greve, M. M. Recent Advances in Emerging Integrated Anticorrosion and Antifouling Nanomaterial-Based Coating Solutions. Environ. Sci. Pollut. Res. 2024, 31, 67550–67576.
https://doi.org/10.1007/s11356-024-33825-6
[26] Farooq, S. A.; Raina, A.; Mohan, S.; Arvind Singh, R.; Jayalakshmi, S.; Irfan Ul Haq, M. Nanostructured Coatings: Review on Processing Techniques, Corrosion Behaviour and Tribological Performance. Nanomaterials. 2022, 12(8), 1323.
https://doi.org/10.3390/nano12081323
[27] Alammar, T.; Bedair, M. A.; Andreeva, N. A.; Al-Odail, F.; Alkhalifah, M. A.; Owda, M. E.; Chaban, V. V.; Abuelela, A. M. Ferrite-Based Materials for Anticorrosion: Comparative Study of ZnFe2O4, CuFe2O4, and SrFe12O19. RSC Adv. 2026, 16(14), 12737–12758.
https://doi.org/10.1039/d5ra08173d
[28] Mhase, P. D.; Pujari, V. C.; Fulari, A. V.; Patange, S. M.; Li, S.; Wang, D.; Shirsath, S. E. Recent Advances in Ferrite-Based Materials for Biomedical Applications: A Comprehensive Review. Adv. Mater. 2026, 38(48), e74149.
https://doi.org/10.1002/adma.74149
[29] Liu, L. Machine Learning-Driven Corrosion Detection and Classification in Pipelines. M.S. Thesis, University of Wales Trinity Saint David, 2024. Available from: https://repository.uwtsd.ac.uk/id/eprint/3305/1/Liwei_Liu_2024_MScThesis.pdf
[30] Reddy, B. V. S.; Shaik, A. M.; Sastry, C. C.; Krishnaiah, J.; Patil, S.; Nikhare, C. P. Performance Evaluation of Machine Learning Techniques in Surface Roughness Prediction for 3D Printed Micro-Lattice Structures. J. Manuf. Process. 2025, 137, 320–341.
https://doi.org/10.1016/j.jmapro.2025.01.082
[31] Liang, X.; Yu, S.; Meng, B.; Ju, Y.; Wang, S.; Wang, Y. Machine-Learning-Guided Design of Nanostructured Metal Oxide Photoanodes for Photoelectrochemical Water Splitting: From Material Discovery to Performance Optimization. Nanomaterials. 2025, 15(12), 948.
https://doi.org/10.3390/nano15120948
[32] Mohammadzadeh, H.; Jafari, R.; Azargoon, A. Mechanical, Morphological, and Corrosion Features of Ni–Cr Oxide Nanocomposite Coating Deposited on SS304 by EPD. Int. J. Appl. Ceram. Technol. 2024, 21(5), 3435–3452.
https://doi.org/10.1111/ijac.14743