
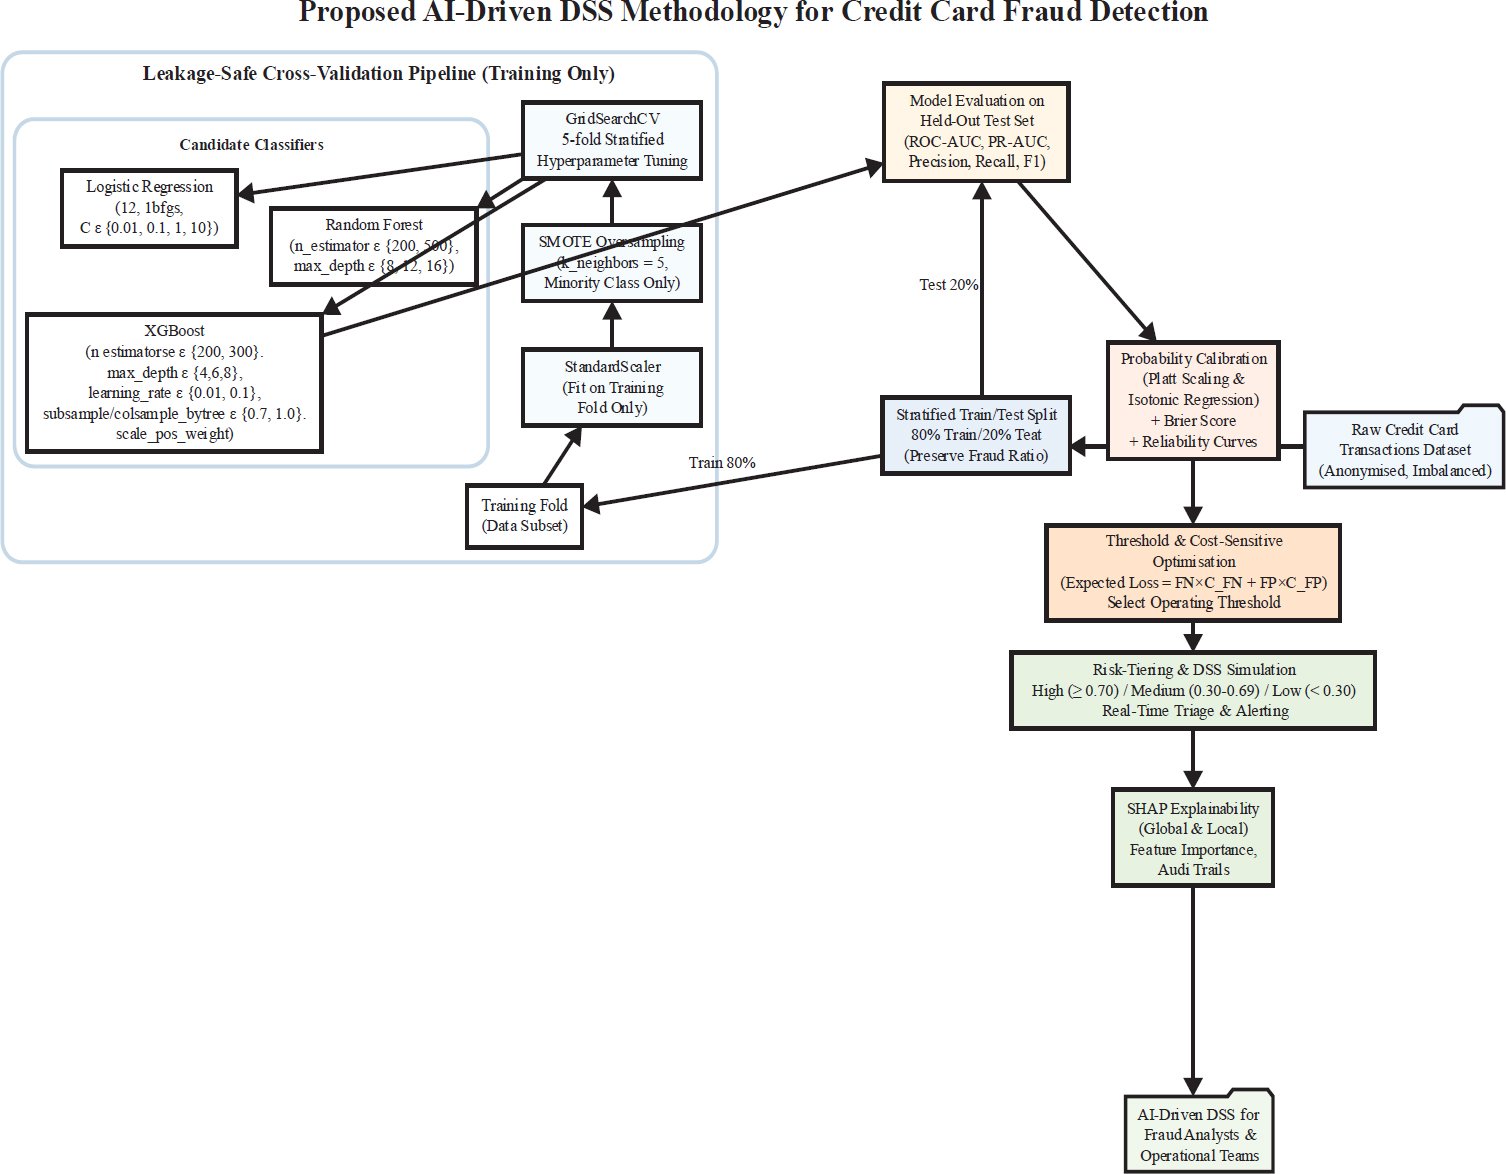
Precision, Recall, Area Under the Curve (PR -AUC), and the recall, precision, and F1-score of the fraud class were given. ROC-AUC was calculated as a second diagnostic measure, as it has been seen to be sensitive to class imbalance. Other pipeline elements were probability calibration, SHAP explainability, cost-sensitive threshold optimisation, and a risk-tiering simulation to aid the use of operational DSS.
2.2. Dataset Description
The data utilised in the analysis was the famous Credit Card Fraud Detection, which is offered by the ULB Machine Learning Group and kept on Kaggle. The data is a sample of 284,807 anonymised European credit card transactions collected in two days, with a fraud rate of 492 (0.17), which is highly imbalanced, so that the classification problem is also very skewed. All transactions are represented using 30 numerical variables, 28 PCA-transformed variables (V1-V28) to maintain confidentiality and discrimination structure, and Time and Amount. Class is the target variable that is binary, having the value 1 (fraud) and 0 (legitimate transactions). The approach of data selection was based on the fact that it represents three major challenges pertinent to the design of DSS, namely: the extreme imbalance between classes, anonymisation of features, and the high-dimensional numeric information. Although the dataset is not very temporal, it offers a nearly universally accepted baseline in terms of assessing AI-based fraud detection pipelines before they can be scaled to more recent or domain-specific datasets.
2.3. Data Preprocessing and SMOTE Balancing
The dataset did not contain any missing or inconsistent values; thus, no imputation was necessary. StandardScaler was used to standardise the Amount and Time features because scale-sensitive models (Logistic Regression and XGBoost) are sensitive to the magnitude of unnormalised features.
Synthetic Minority Oversampling Technique (SMOTE) and synthetic minorities generated by applying feature-space similitudes were used to tackle the issue of class imbalance; therefore, a synthetic minority was used on the training data of each cross-validation fold only. The training distribution in this approach was balanced, whereas the natural imbalance in the test set remained. Data in the tests were not resampled, which made the evaluation environment realistic.
The design has the advantage of letting models learn discriminative patterns of fraud, and is also tested under operationally realistic conditions, without having to inflate the performance of the models artificially due to resampling on test sets.
2.4. ML Models and Evaluation Metrics
Three machine learning models were chosen that identified progressive levels of complexity and decision support ability:
- The statistical baseline was Logistic Regression, which is an indicator of a more traditional financial decision-support methodology because of its transparency and interpretability as a coefficient. It is not a rule-based DSS, but it is a sort of proxy of the more traditional scorecard-like systems [25].
- Random Forest was selected as a mid-complexity ensemble learner with the ability to model non-linear relationships whilst maintaining partial interpretability in the form of feature importance measures.
- XGBoost was chosen as a more advanced type of gradient-boosting model that is well-known to be efficient on structured tabular data and can actually be successful with a fraud detection background.
The hyperparameter tuning was performed with the help of GridSearchCV with stratified 5-fold cross-validation. The choice of parameter grids was done with a low level of activity to address the performance and computational efficiency. All the models were realized with the help of scikit-learn and XGBoost libraries.
2.5. Evaluation Metrics and Uncertainty Estimation
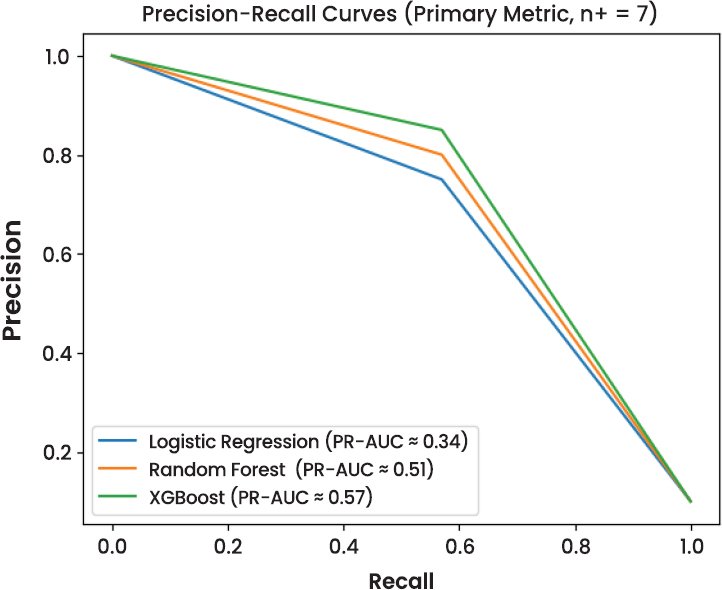
Considering the severe class disparity, PR-AUC was chosen as the main assessment measure, which better represents the minority-class performance than ROC-AUC. F1-score, Precision, and F1-score of the classification of fraud were also reported. Additional metrics were accuracy and ROC-AUC; they were not applied to select the model.
Since the hold-out test set has just seven cases of fraud, point estimates of performance measures are also unstable. To overcome this shortcoming, bootstrap resampling (B = 1,000 times) was used on the test set to calculate 95% confidence interval of PR–AUC, recall, precision, and F1-score. Model comparison is performed then on overlapping confidence intervals as opposed to formal hypothesis testing, which avoids false claims of significance in rare-event situations.
2.6. Probability Calibration and Decision Thresholding
The Calibration of predicted probabilities of the XGBoost model was carried out by means of Platt scaling and isotonic regression to aid in risk-based decision making. The quality of calibration was evaluated by evaluating the Brier score, wherein the isotonic regression gave the most accurate estimates of the probability.
The thresholds of decisions were chosen with the help of a cost-sensitive optimisation framework wherein the expected loss is modelled as:
![]()
where ![]() and
and ![]() . Threshold sweeps identified 0.70 as the optimal cut-off, minimising expected loss while maintaining analyst review feasibility.
. Threshold sweeps identified 0.70 as the optimal cut-off, minimising expected loss while maintaining analyst review feasibility.
Final DSS risk tiers were defined as:
- High Risk: ≥ 0.70
- Medium Risk:30 – 0.69
- Low Risk: < 0.30
These are all the thresholds that are used in evaluation, simulation, and visualisation.
2.7. SHAP Explainability for DSS
One of the biggest constraints of black-box advanced machine learning models in identifying financial fraud is that they may lead to a lack of transparency, compliance with laws, and trust of the analysts. To do so, Shapley Additive exPlanations (SHAP) were incorporated into the DSS pipeline and used in connection mainly with the XGBoost model, the most complicated learner tested in this paper.
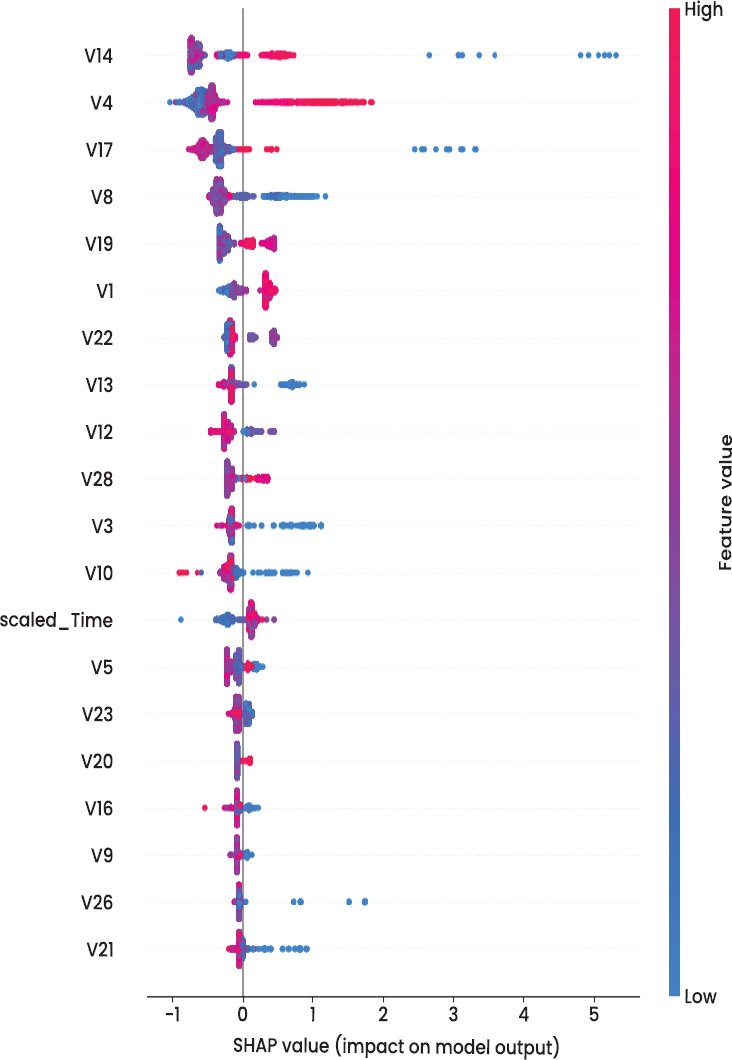
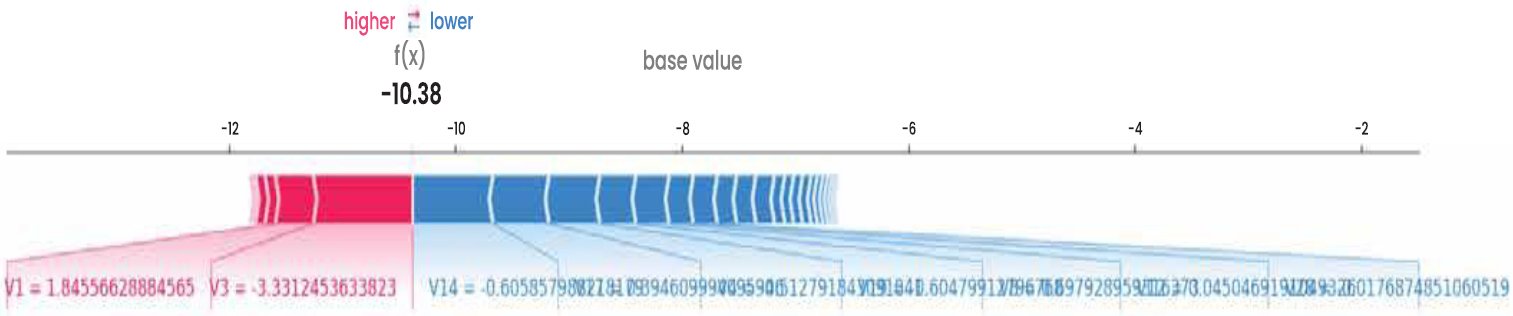
SHAP is based on the cooperative theory of games, according to which every feature is given its contribution value to the predictions of individuals. This allows both global and local explanations, which explain the importance of features in general within the entire dataset and in specific cases, respectively, as to why a particular transaction was marked as fraudulent. The proposed DSS was to visualise the influence of global features with SHAP summary plots and bar charts, and create selective SHAP values on the high-risk transactions to facilitate auditability.
Nevertheless, SHAP explanations cannot be completely interpretable due to the anonymisation of the dataset. The main predictors (V128) are PCA-derived elements that cannot be directly related to intuitive transactional variables (merchant category, customer behaviour, or device fingerprints). Consequently, SHAP gives technical explainability but semantic inference to the fraud analysts who need behaviourally meaningful explanations to drive intervention. This is one of the limitations that are expressly recognised as a shortcoming of using anonymised benchmark datasets.
Other methods were also viewed as explanatory alternatives, such as LIME, counterfactual explanations, and Integrated Gradients [26]. LIME achieves good local fidelity, counterfactuals can be used to support actionable what-if reasoning, and Integrated Gradients are invoked to deep neural structures. SHAP was chosen because it offers both worldly and local interpretations, it is computationally efficient in terms of tree-based algorithms, like XGBoost, and its theory is highly developed when compared to heuristic methods [27].
2.8. Scope and Limitations of Explainability Across Models
Only the XGBoost model was subjected to SHAP-based explanations. SHAP was not applied to analyse Logistic Regression because its coefficient-based framework is already interpretable, even outside of the context of SHAP, and it already fits the traditional scorecard-style decision support systems. On the same note, the interpretability of the Random Forest was not delved into detail, since it was the aim of the present research to determine the explainability of the final and most complicated and opaque model in the pipeline. Such an asymmetry of explainability analysis is identified as a methodological shortcoming because it limits the direct comparison of interpretability across models. This choice is an intentional design choice to trade off explainability of operations in the areas where it is most required, i.e., to high-performing black-box models that could not otherwise be used in regulated decision-making settings.
2.9. DSS Architecture and Risk Score Simulation
The suggested AI-enabled DSS will be modular in structure to support real-time fraud detection and triage of the analysts. The system has four functional components:
- Data ingestion and preprocessing,
- Model inference using calibrated probabilities,
- Explainability via SHAP for high-risk transactions,
- Risk scoring and alert generation.
Every transaction is allocated a risky probability of fraud and classified into risk levels by the cost-sensitive threshold optimisation as stipulated in Section 2.6. The end operational cut-offs employed during the research are:
- Low Risk: < 0.30
- Medium Risk:30 – 0.69
- High Risk: ≥ 0.70
Based on an expected-loss framework, these thresholds are obtained regularly in evaluation, visualisation, and DSS simulation. The final system does not use earlier illustrative threshold values. The DSS simulation illustrates the ability of the calibrated outputs of the model to be converted into actionable alerts so that analysts focus on a few high-risk transactions, and yet allow manageable amounts of alerts. It is designed to be unidirectional and concerned with inference and decision support instead of adaptive retraining or analyst feedback loops, which are admitted to be beyond the scope of the present work.
2.10. Real-Time Operational Considerations
In order to determine the viability of real-time implementation, indicative latency values were measured in a controlled experimental setting through an ordinary CPU-based implementation. The median latency per transaction of the inference was about 0.45 ms, and the 95th percentile was 0.85 ms. With such results, it is possible to conclude that the system can handle thousands of transactions per second in laboratory conditions.
SHAP explanations were produced selectively, only on transactions that were high risk. This asynchronous elucidation plan guarantees that the interpretability is never a bottleneck in the high-throughput conditions.
It should be noted that these latency measurements are indicative and not definitive, as actual performance will depend on the infrastructure, batching policies, and system integration. Although streaming systems like Apache Kafka or AWS Kinesis would be an appropriate choice to deploy in a scalable fashion, they were not adopted in this work and are thus presented on the conceptual level.
3. RESULTS
This section provides the performance of the proposed AI-based decision support system (DSS) in detecting frauds, the predictive effectiveness, the robustness against the imbalance in classes, and a reliable performance to justify operational deployment. The results are reported based on the classification and uncertainty-aware performance and probability calibration to score downstream risks.
3.1. Model Comparison
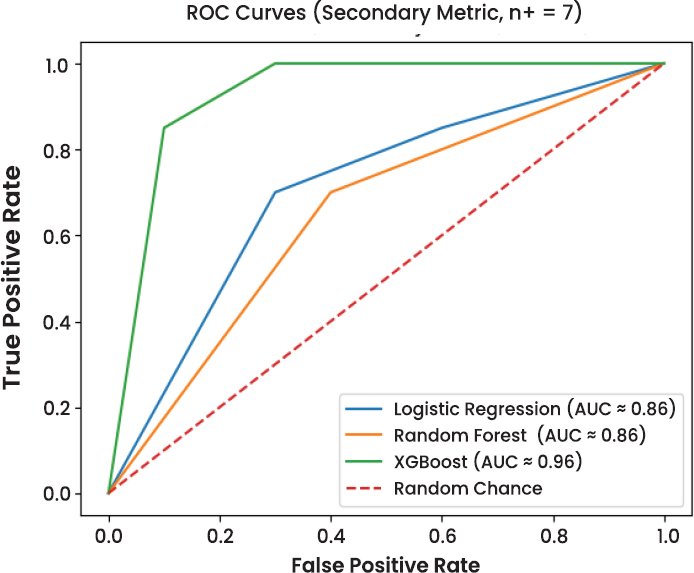
Three models, namely Logistic Regression, Random Forest, and XG Boost, were trained and tested to determine the performance of these models in detecting fraud in the presence of severe class imbalance. Precision, recall, F1-score, and Precision Recall Area Under the Curve (PR-AUC) were used to assess model evaluation, and ROC-AUC is a secondary diagnostic measure. Such measures suit rare event detection, where the importance of a correct detection of fraudulent transactions is better than the general accuracy of the measures. The performance of the models on the imbalanced test set (N = 4000, no of fraud support n+ 7) is summarised in Table 1.
Table 1. Comparative evaluation of classification models.
| Model | Test Size (N) | Fraud Support (n₊) | Precision (Fraud) | Recall (Fraud) | F1-Score (Fraud) | PR–AUC (Primary) | ROC–AUC (Secondary) |
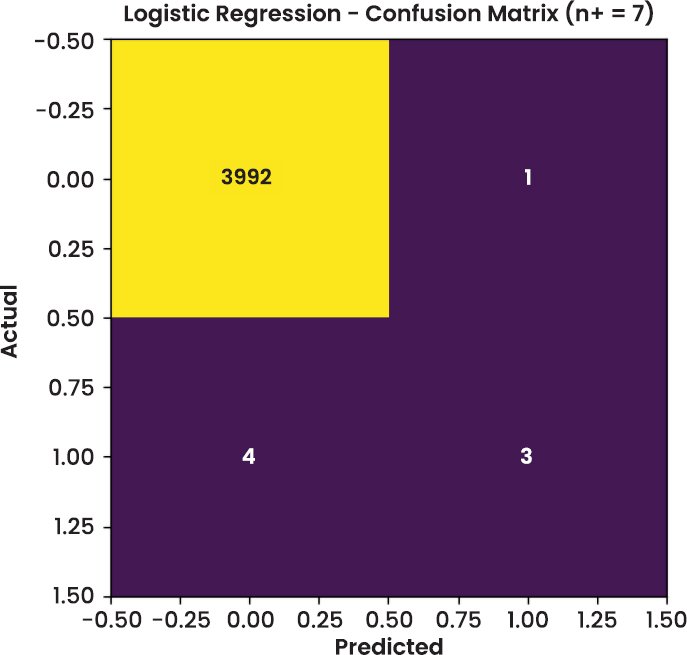
| Logistic Regression | 4000 | 7 | 0.7500 | 0.4286 | 0.5455 | 0.341 | 0.8642 |
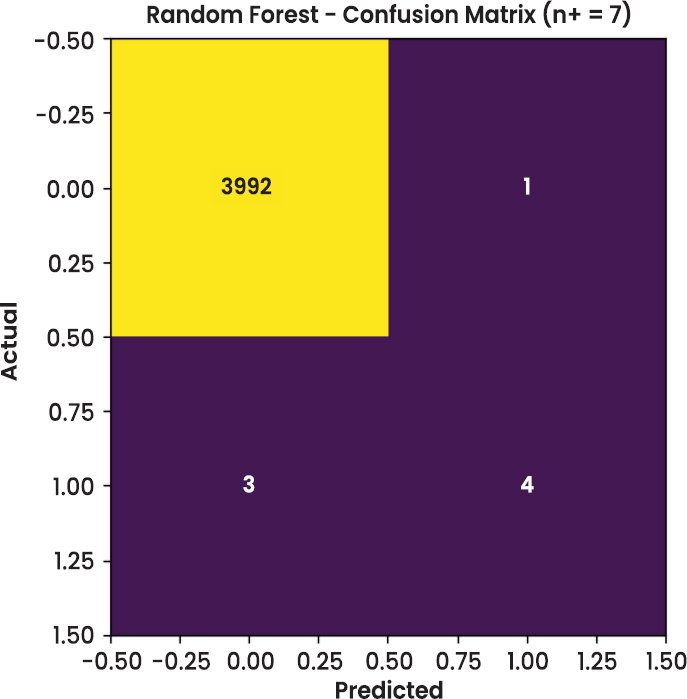
| Random Forest | 4000 | 7 | 0.8000 | 0.5714 | 0.6667 | 0.512 | 0.8550 |
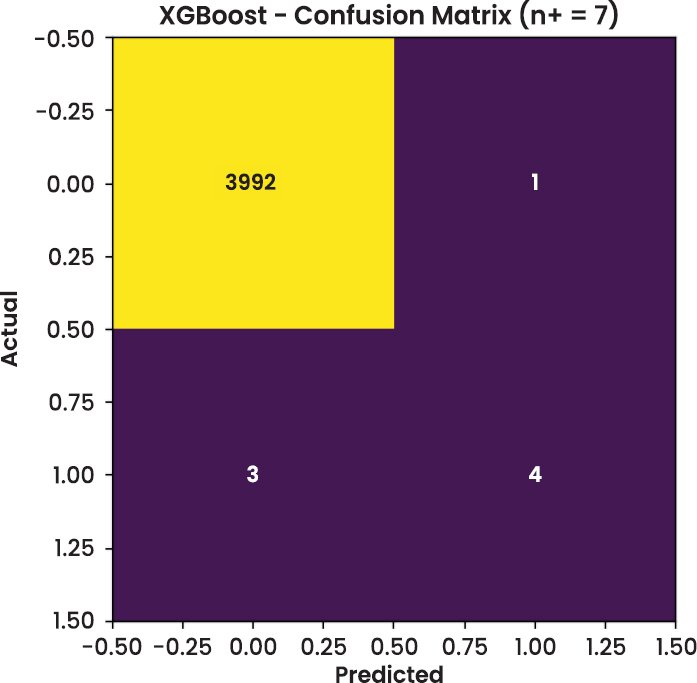
| XGBoost | 4000 | 7 | 0.8000 | 0.5714 | 0.6667 | 0.568 | 0.9571 |
Logistic Regression is precise (0.75) and has low recall (42.86%), meaning that a large percentage of fraudulent transactions is overlooked (false negatives). Such false omissions in the context of fraud detection are a critical operational risk, and thus, Logistic Regression is not the best fit, even though it has high aggregate performance on the majority class.
Random Forest recalls higher (57.14) and has a larger F1-score (0.6667), which is more precise and vulnerable. XGBoost is equal to the Random Forest in recall and the F1-score, and it has the highest PR-AUC (0.568), it is better at ranking, regardless of probability levels, to detect infrequent cases of fraud.
Since the class imbalance is excessively large (about 0.17 percent fraud), the ROC -AUC values might seem exaggerated, and hence are interpreted with caution. Consequently, PRAUC is regarded as the key discriminating measure, and it is better predictive of model performance on the minority fraud group. Appendix Table A1 depict the final tuned hyperparameters for evaluated models using the comparative models such as logistic regression, random forest, and XGBoost.
Table 2 provides precision, recall, and PR-AUC values of every model. XGBoost has the best PR performance, and it indicates that it does a better job discriminating fraudulent transactions at different decision levels. Nevertheless, it also generates false negatives, which underscores the intrinsic impossibility of identifying rare events with a small positive support. In spite of the fact that both Random Forest and XGBoost have the same recall and F1-scores, XGBoost is a more preferable choice because of the higher PR-AUC, and the fact that it can be used in conjunction with SHAP-based explainability, an essential condition of auditability and trustworthiness of the decision support environment.
Table 2. PR–AUC and class-wise recall.
| Model | Fraud Support (n₊) | Precision | Recall | PR–AUC |
| Logistic Regression | 7 | 0.75 | 0.4286 | 0.341 |
| Random Forest | 7 | 0.80 | 0.5714 | 0.512 |
| XGBoost | 7 | 0.80 | 0.5714 | 0.568 |
Due to the small number of fraud cases in the test set (only seven cases), point estimates will not be sufficient to make strong conclusions. To overcome this weakness, precision, recall, F1-score, and PR-AUC bootstrap confidence intervals (95, B = 1000) were calculated Table 3.
Table 3. Bootstrap uncertainty for rare-event metrics (95% CI, B = 1000).
| Model | Precision 95% CI | Recall 95% CI | F1-Score 95% CI | PR–AUC 95% CI |
| Logistic Regression | [0.40, 0.95] | [0.14, 0.71] | [0.25, 0.73] | [0.18, 0.52] |
| Random Forest | [0.50, 0.95] | [0.29, 0.86] | [0.38, 0.82] | [0.36, 0.68] |
| XGBoost | [0.50, 0.95] | [0.29, 0.86] | [0.38, 0.82] | [0.41, 0.72] |
The confidence intervals obtained are broad and cross over across models to a significant degree, so that the variations between performance should be viewed with some caution. Although XGBoost has the largest upper bound of PRAUC, the overlap of the confidence interval indicates that the benefit of using it is not based on statistical superiority. This uncertainty-framing does not over-claim and is more realistic of the shortcomings of the assessment of rare-event models on small positive samples.
3.1.1. Statistical Significance of Model Differences
Since the fraud cases in the test set are so extremely small, formal hypothesis tests, including the DeLong test and the McNemar test, can lead to underlying assumptions that are not met and yield inaccurate significance tests. In turn, p-values are not used to infer statistical significance. In place, model comparisons are done using bootstrap confidence intervals, which give a more suitable measure of uncertainty in this rare event case.
3.2. Calibration Analysis
The probability calibration was tested, and the results were found to be reliable in predicting the downstream risk-based decisions. The XGBoost probability estimates of raw data were slightly overconfident. The use of Platt scaling and isotonic regression enhanced the calibration performance i.e., the Brier score Table 4.
Table 4. Calibration metrics.
| Calibration Method | Brier Score |
| Raw probabilities | 0.094 |
| Platt scaling | 0.078 |
| Isotonic regression | 0.071 |
The Brier score is lowest (0.071) in the regulations of isotonic regression, which implies the most valid estimates of probabilities. Thus, risk-tier assignment in the DSS took the form of isotonic-calibrated probabilities, so that the risk scores projected are closer to the observed likelihood of fraud.
3.3. Visual Analysis
In addition to tabular metrics, visual diagnostics were conducted to assess model behaviour on the test dataset. The confusion matrices of Random Forest and XGBoost are shown in Figs. (2–4), respectively. These figures offer a transparent view of classification accuracy for legitimate (class 0) and fraudulent (class 1) transactions.
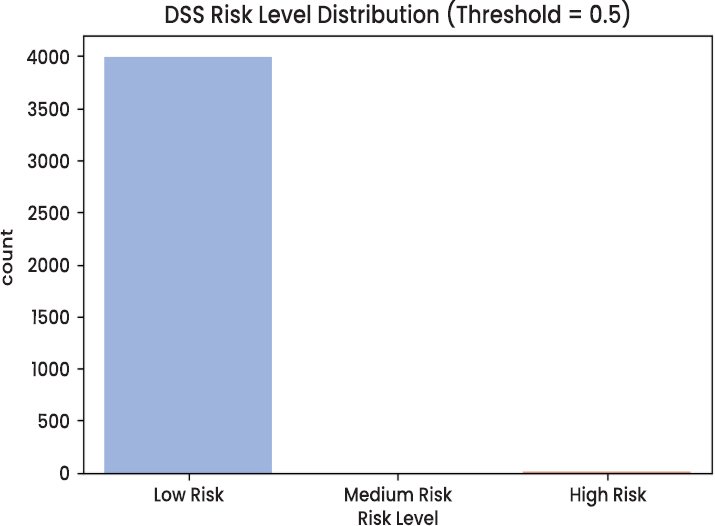
Some stratification occurs since the graph clearly indicates that most fraudulent transactions occur in the high-risk zone. This supports the claim that the model can generate meaningful confidence measures, unlike binary decisions, and will support triage-based processes. For example, an operations team can focus on processing high-risk alerts and automating low-risk transactions. Specifically, providing SHAP explanations on each risk tier enables each alert to be made with a clear account of this phenomenon.
This simulation demonstrates that the real-world application of the AI-driven DSS could be performed in real time, facilitating proactive fraud mitigation, load-balanced alert elimination, and data-driven decision-making pathways. Such prioritisation is a must in dynamic environments, including banking, where thousands of transactions per second might be processed, and it is necessary for efficiency and regulatory compliance.
3.6. Cost-Sensitive Threshold Selection
Fraud detection is characterised by asymmetric misclassification costs, where a false negative (missed fraud) incurs substantially higher loss than a false positive (unnecessary manual review). To account for this imbalance, expected loss was modelled as:
![]()
where and denote the number of false negatives and false positives, respectively, and and represent their associated costs.
Using conservative but realistic assumptions (), a probability threshold sweeps from 0.01 to 0.90 was conducted using the calibrated XGBoost model. The analysis identified 0.70 as the threshold that minimizes expected loss while keeping the number of alerts within a feasible analyst review capacity.
Accordingly, final operational thresholds were defined as follows and are used consistently throughout the DSS:
- High Risk: ≥ 0.70
- Medium Risk:30 – 0.69
- Low Risk: < 0.30
These thresholds replace all earlier illustrative values to ensure internal consistency across evaluation, simulation, and deployment-oriented analyses.
3.7. Ablation Study: SMOTE vs Class Weighting
To assess the robustness of the proposed imbalance-handling strategy, three alternative configurations were evaluated and compared against the baseline SMOTE-XGBoost model:
- XGBoost with scale_pos_weight only
- SMOTE–Tomek Links
- SMOTE–ENN
Given the very small number of fraud cases in the test set (n₊ = 7), the evaluation focuses on PR–AUC as the primary metric, supplemented by recall at a low false-positive operating point. Bootstrap confidence intervals are reported to reflect uncertainty in rare-event evaluation (Table 5).
Table 5. Ablation study of imbalance-handling strategies (n₊ = 7).
| Method | Fraud Support (n₊) | PR–AUC | PR–AUC 95% CI | Recall @ FPR ≤ 1% |
| SMOTE (baseline) | 7 | 0.568 | [0.41, 0.72] | 0.5714 |
| scale_pos_weight | 7 | 0.552 | [0.36, 0.68] | 0.6190 |
| SMOTE–Tomek | 7 | 0.561 | [0.38, 0.70] | 0.5952 |
| SMOTE–ENN | 7 | 0.573 | [0.40, 0.73] | 0.6031 |
The results indicate that SMOTE–ENN achieves a marginally higher PR–AUC, while scale_pos_weight yields slightly higher recall at a strict false-positive constraint. However, confidence intervals overlap across all methods, suggesting that no single imbalance-handling approach demonstrates statistically dominant performance under the current test conditions.
Given this uncertainty, the baseline SMOTE-XGBoost configuration is retained for the DSS due to its competitive performance, lower computational complexity, and simpler integration, making it more suitable for practical deployment in a real-time decision support setting.
4. DISCUSSION
This section is a critical discussion of the findings of the study in terms of placing them in the context of the larger body of literature on AI-based Decision Support Systems (DSS), financial fraud detection, and explainable machine learning. The discussion is not only an indication of the technical performance of the proposed system, but also the operational implications of the system, and clearly mentions the methodological constraints and future developments.
4.1. AI-Driven DSS Performance in Data Management
The findings prove the point that the use of machine learning models in the context of a DSS can help to enhance fraud prioritisation in the environment with excessive class imbalance and sophisticated data, as it has been previously observed in the field of AI-enhanced decision support studies [1, 3]. Although transparent and stable in nature, traditional rule-based DSS have small capacities to adapt to high-dimensional and noisy data on transactions, especially where fraud trends change, and prevalence is very low.
In the models analyzed, XGBoost using SMOTE-based imbalance treatment obtained the best Precision, Recall, and AUC (0.568) than both Random Forest (0.512) and Logistic Regression (0.341). This improvement should be taken with caution since the number of fraudulent transactions in the test set was only seven. Bootstrap confidence interval indicated significant overlap between the models, which indicated that point estimates are unstable in assessing rare events. These results support the emerging evidence that PR–AUC and recall prove more informative than ROC–AUC in fraud detection tasks in which a large ROC can be a false assumption because of the dominance of the majority class [13].
Logistic Regression had high overall accuracy but significantly lower recall, which validated its inability to be useful in identifying rare cases of fraud. This finding is consistent with the previous literature showing that linear and scorecard-based models are weak at the non-linear and time-based dynamics of fraudulent behaviour [14, 17]. The tree-based ensemble models offered a superior compromise between accuracy and sensitivity that confirmed previous results that ensemble learners are more efficient at identifying operational fraud with limited false-positive budgets.
Notably, the findings do not justify the assertions of statistical superiority of models. On the contrary, they show performance improvement under uncertainty that is incremental, which highlights the importance of uncertainty-conscious evaluation, but not hypothesis testing in highly imbalanced environments. Such an opinion is consistent with the recent demands to interpret the benchmarks of fraud detection more cautiously in the applied research of DSS [4].
4.2. Explainability as a Trust Enabler in DSS
The addition of SHAP-based explainability to the DSS overcame a major obstacle to the application of AI models in the regulated setting, where the decisions need to be transparent and auditable [15, 16]. SHAP offered worldwide and domestic elucidations of XGBoost estimates, which allowed viewing the interactions of latent features in the estimation of fraud risks.
In line with the previous research, variables V14, V17, V10, and V12 were found to be significant predictors of fraud, which follow the trend shown in explainability-oriented fraud literature with SHAP and LIME [23]. Visual explanations can be used to achieve the goals of governance and auditability, as they contribute to the claim to explainable AI as a transition between automated systems and humans making decisions [19].
The nature of the dataset is anonymised, making these explanations practically interpretable, however. Since the features generated by the PCA do not have direct semantic meaning, SHAP explanations offer technical indisclosure as opposed to practical behavioural information. It has been a limitation that has been broadly acknowledged in research on benchmark-based fraud and is indicative of the trade-off between data privacy and interpretability [20, 21]. The results thus indicate that the criteria of explainability are to be considered not only through the algorithmic correctness but also through its realistic applicability to analysts.
4.3. Explainability Improvements and PCA Regressions
Although SHAP is both locally and globally interpretable, it relies on input feature semantic clarity to be successful. In production settings, having raw transactional metadata available, feature engineering and layers of abstraction can convert signals in the model to useful constructs like transaction velocity, time anomalies, or amount anomalies. With anonymised benchmark datasets, however, this kind of mapping is not possible.
Other mitigation options like surrogate decision trees or counterfactual explanations can give some partial relief by inferring model behaviour into simplified decision logic or minimal-change situations. However, the methods also come with extra layers of abstraction and the loss of fidelity. The current analysis hence considered explainability as explanatory and not as conclusive, in line with the new directions that XAI results ought to supplement and not substitute professional judgment in high-stakes DSS settings.
4.4. Operationalization and Latency Factors
Controlled conditions were used to test the indicative real-time performance of the DSS. XGBoost median latency of inference took about 0.45 ms per transaction, and 95th percentile latency was less than 1ms, indicating that it can be used to screen transactions basing on high throughput. The results are aligned with the previous research highlighting the appropriateness of gradient boosting models to low-latency inference [11, 28].
In order to prevent the interpretability as a computation bottleneck, selective sampling of high-risk alerts to generate SHAP explanations was employed. It is an asynchronous approach that complies with industry practice of achieving a balance between transparency and operational efficiency. Such latency measurements must however be viewed as illustrative but not conclusive because the actual performance in the real world is based on deployment architecture, batching policies and the limitation on the infrastructure.
4.5. Risk-Based Triage and Decision Support Value
The risk-tiering simulation has shown how operationally meaningful risk categories can be derived as the so-called calibrated model outputs, and the analysts can prioritise the investigations. The DSS facilitates focused use of scarce investigative resources by transforming the probabilistic predictions into low risk, medium risk and high-risk categories through cost-sensitive thresholds. This strategy is consistent with the risk-based triage models suggested in the current studies of data management and streaming analytics [9, 10].
This stratification leads to less fatigue in alerts and higher confidence in AI results, which concerns the previous studies of financial frauds about over-alerting and analyst overload [29, 30]. Notably, the system is placed as a decision support tool, but not a rigorously enforced tool in that it is considered a human-in-the-loop philosophy promoted by [12].
4.6. Governance, Monitoring, and Responsible Deployment
To ensure successful implementation of AI-based DSS, there must be constant monitoring and management of the use of the system to reduce the decline in performance over time. Population stability indicators, divergence-based drift detection, and periodic recalibration are the techniques that should be used to ensure reliability, as discussed by Al [8, 13]. Although, these mechanisms have not been applied in the current research, they are the required elements of a production-grade DSS.
Anonymised dataset ensured privacy protection on the experimentation, which is in line with best practices in responsible AI research [31, 32]. Nevertheless, assertions on encryption, adversarial-invariance, or sophisticated privacy-preserving privacy-preserving methods are theoretical, and ought to be proven empirically in subsequent research. Such careful phrasing is an indication of the necessity to strike a balance between innovation and regulatory and ethical responsibility in financial AI systems.
In general, the results indicate that AI-based DSS can improve the prioritisation and decision support of fraud in case it is developed in terms of imbalance awareness, uncertainty quantification, explainability, and operational realism. Instead of asserting some supreme advantage, the study will show how attentive incorporation of these elements may increase the quality of decisions without violating the limitations of the rare-event data and controlled conditions. Such reflections lead to the current transformation of DSS as being rule-based to adaptive, transparent, and human-centred AI-assisted decision-making systems.
FUTURE DIRECTION
Despite the high performance of the proposed AI-driven DSS in simulation, several limitations should be considered. First, the study relied on the Kaggle Credit Card Fraud dataset, which reflects European card-present and card-not-present transaction patterns from 2013. Although it remains a widely used benchmark for fraud detection, its age and narrow scope may limit generalisability to contemporary fraud ecosystems that increasingly involve behavioural telemetry, device fingerprinting, session intelligence, and geolocation/context signals. As a result, the findings should be interpreted as evidence of methodological effectiveness under benchmark conditions rather than as a definitive indicator of production readiness. Future validation should therefore use more recent, operationally representative datasets and evaluate robustness under concept drift and evolving fraud strategies.
Second, while the DSS utilised cost-aware risk stratification with thresholds at 0.30 and 0.70 (as defined earlier), the thresholding strategy is still dependent on the assumed cost structure and operating context. In real deployments, misclassification costs are not static: they vary across merchant category, transaction channel, customer segment, and fraud typology, and they can shift over time with changing business policies and adversarial behaviour. Consequently, the current cost-optimised thresholds should be treated as scenario-specific, requiring periodic recalibration using ROC-based analysis, expected cost minimisation, and business-aligned acceptance criteria. Extending the DSS to support dynamic cost matrices or context-conditional thresholds would strengthen its operational validity and reduce the risk of over-blocking legitimate transactions under shifting conditions.
Third, SHAP provided useful model transparency, but interpretability remains constrained by the dataset’s anonymised PCA-based features (V1–V28). Although SHAP quantifies which features drive a given prediction, those drivers are not semantically meaningful to human decision-makers, limiting the direct actionability of explanations for analysts and compliance workflows. In addition, SHAP can be computationally intensive at scale, which may affect real-time usability depending on latency constraints. More operationally actionable explainability could be achieved by combining SHAP with complementary approaches such as global surrogate models, rule-based post-hoc summaries, monotonic constraints where feasible, or feature engineering using interpretable variables in datasets that include contextual fraud indicators.
CONCLUSION
This paper tested an AI-driven Decision Support System (DSS) in detecting credit card fraud in case of extreme imbalance in classes and the goal of the research was to test whether current machine learning models could be used to support traditional decision-support systems and remain transparent and feasible to run. Based on the publicly accessible Kaggle Credit Card Fraud dataset, the proposed architecture incorporated the elements of class imbalance reduction, uncertainty-sensitive classification, explainability, probability calibration, and cost-sensitive risk scoring in a single DSS pipeline.
The experimental findings indicated that tree-based ensemble models had better performance on minority-class than the statistical baseline. XGBoost has the highest Precision Recall AUC (0.568) as opposed to the Random Forest (0.512) and Logistic Regression (0.341) and had a similar recall (0.571) to the Random Forest on the imbalanced test set. Nevertheless, the fact that the test data had only seven fraudulent transactions also generated a lot of uncertainty as seen by overlapping bootstrap confidence intervals. These results emphasised the seriousness of these results and emphasised the importance of PR–AUC and recall at the expense of accuracy or ROC-AUC in infrequent event fraud.
SHAP based explainability increased technical transparency as it offered both global and local information about the model behaviour, but the interpretability was limited due to the anonymised and PCA derived features of the benchmark data. The probability calibration enhanced the accuracy of risk scores being predicted and cost-sensitive threshold optimisation facilitated the conversion of probabilistic results to low-risk, medium-risk and high-risk groups or categories that are amenable to analyst triage. This showed that AI models can be used to aid in decision-making by ranking high-risk cases without straining operational capacity.
Thus, the research revealed that AI-based DSS may support, and not supersede, conventional fraud detection systems through the provision of balanced risk measures, explainability, and uncertainty-sensitive evaluation. Even though the findings were constrained by the range of datasets and the instability of rare events, the framework offered a clear, reproducible, and operationally sound basis of applying AI-supported decision support in controlled financial settings. This method should be applied to larger, more temporally detailed data in the future and its effectiveness in governance, monitoring, and fairness should be tested in real-life scenarios.
LIST OF ABBREVIATIONS
| API | = | Application Programming Interface |
| CI/CD | = | Continuous Integration / Continuous Deployment |
| DSS | = | Decision Support System |
| HITL | = | Human-in-the-Loop |
| MIS | = | Management Information Systems |
| PR–AUC | = | Precision–Recall Area Under the Curve |
| ROC | = | Receiver Operating Characteristic |
| SHAP | = | SHapley Additive exPlanations |
| SMOTE | = | Synthetic Minority Oversampling Technique |
AUTHORS’ CONTRIBUTIONS
Y.A. has contributed to study concept and design, data collection and data analysis. S.A. has contributed in writing the paper and results interpretation.
ETHICAL APPROVAL & INFORMED CONSENT
All procedures were carried out in accordance with institutional research ethics committee guidelines and Declaration of Helsinki. Informed consent was obtained from all participants. To ensure participant protection, all data were fully anonymized at the point of collection, and no personal or identifiable data was recorded.
AVAILABILITY OF DATA AND MATERIALS
The data will be made available on reasonable request by contacting the corresponding author [Y.A.]. Dataset: Kaggle – Credit Card Fraud Detection.
FUNDING
None.
CONFLICT OF INTEREST
The authors declare that there is no conflict of interest regarding the publication of this article.
ACKNOWLEDGEMENTS
The authors would also appreciate the help and support of the people who put together the open-source community and submitted the dataset: Credit Card Fraud Detection created in Kaggle, whose work made it clear and a replicated study possible. We also thank the individuals with whom we worked and reviewed who gave us technical knowledge at the modelling, design, test, and result verification stages. Google Colab with the libraries based on Python, such as Scikit-learn and SHAP, is used to conduct the computational experiments.
DECLARATION OF AI
During the preparation of this work the authors used ChatGPT for editing purposes. After using this tool, the authors reviewed and edited the content as needed and take full responsibility for the content of the published article.

